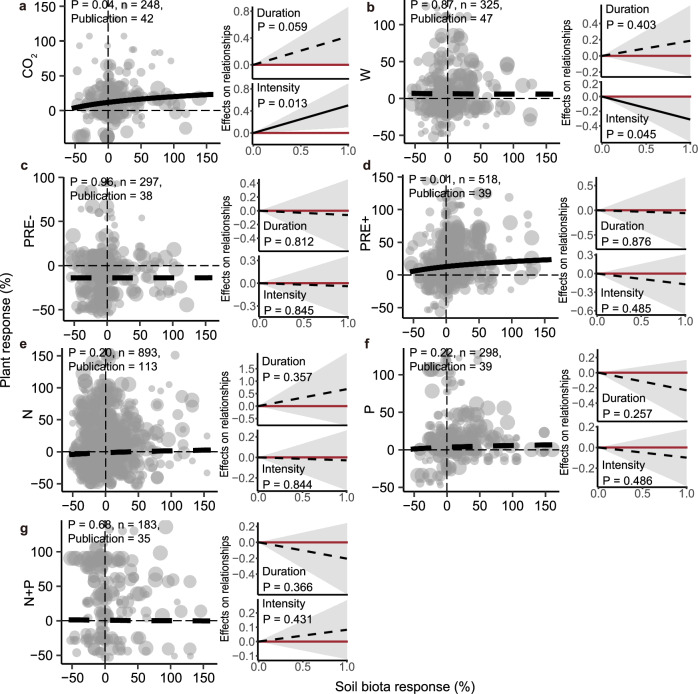
Fig. 3. Overall relationships between the responses of plant and belowground soil biota under GCFs.
Overall relationships between the responses of plant and belowground soil biota for seven GCFs (a–g) at the left panel, and the effect of experimental treatments (duration and intensity) on the coupling coefficients of the relationships for each GCF at the right of the panel. The aboveground and belowground responses represent the relative changes of biomass, diversity, and abundance in plants and soil biota to different GCFs based on paired data. Relative changes were calculated as the logarithm of the ratio of the variable within each treatment plot divided by the same variable in the control plot. Point size indicates the weight of the sample size. P-values represent the statistical significance of coefficients by the two-sided z-test, and n represents study observations, respectively. Different lines indicate fitted relationships for each treatment based on the “REML” method in mixed-effects meta-regression. The solid lines indicate a significant difference (P < 0.05) from zero for the coupling coefficient, and the dashed lines indicate non-significance.

