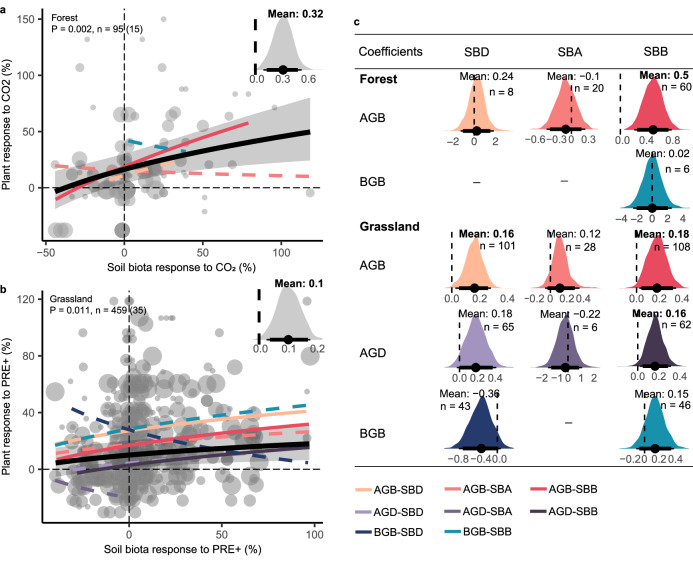
Fig. 4. Significant linkages between the responses of plant and belowground soil biota under specific GCFs and relationship types.
a Positive relationships between the responses of the plants and soil biota under CO2 in forests and (b) under PRE+ in grasslands. Point size indicates the weight of the sample size. P values represent the statistical significance of coefficients by the two-sided z-test, and n represents study observations, respectively. The solid lines indicate a significant difference (P < 0.05) from zero for the coupling coefficient, and the dashed lines indicate non-significance. Black lines show overall relationships between the responses of the aboveground and belowground compartments, the shades represent 95% confidence intervals. Other colored lines show different relationship types between corresponding variables of plants and soil biota. The posterior distribution of the coefficient is based on the Bayesian hierarchical meta-regression. The gray distribution indicates the posterior coefficient distribution of the overall relationship. c Different colored posterior distributions represent corresponding relationship types between plant aboveground biomass (AGB), plant belowground biomass (BGB), plant diversity (AGD) and soil biota diversity (SBD), soil biota abundance (SBA), soil biota biomass (SBB). Points indicate the mean of coefficients, and thick and thin bars represent 95% and 90% confidence intervals, respectively.

