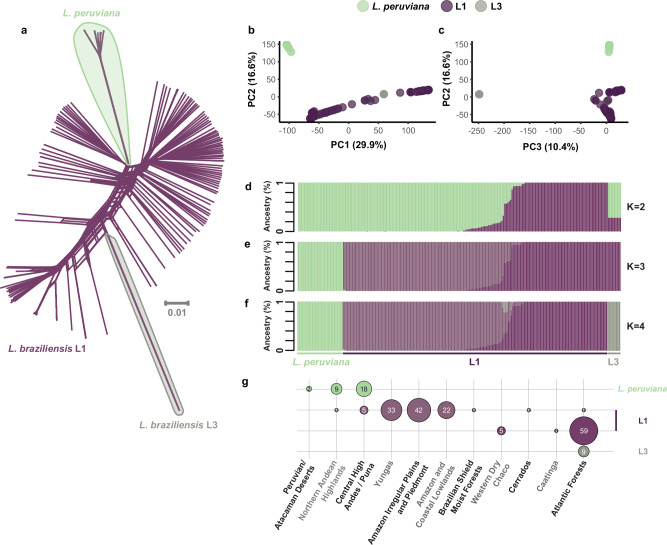
Fig. 2. Divergence within the L. braziliensis clade.
a A phylogenetic network, based on 695,229 genome-wide SNPs, showing uncorrected p-distances between 222 isolates of the L. braziliensis clade (incl. L1, L3, and L. peruviana). b, c Principal component analysis for the 222 isolates showing the first three PC axes. d–f ADMIXTURE bar plots showing the estimated ancestry per isolate assuming K = 2 (d), K = 3 (e), and K = 4 (f) ancestral components. g Sample size distribution of Leishmania isolates from each group and per ecoregion. The four colours match the four ancestral components as inferred with ADMIXTURE K = 4 (f). Only isolates with at least 70% ancestry for a specific ancestral component were included. Ecoregion data is available from: https://gaftp.epa.gov/EPADataCommons/ORD/Ecoregions/sa/.

