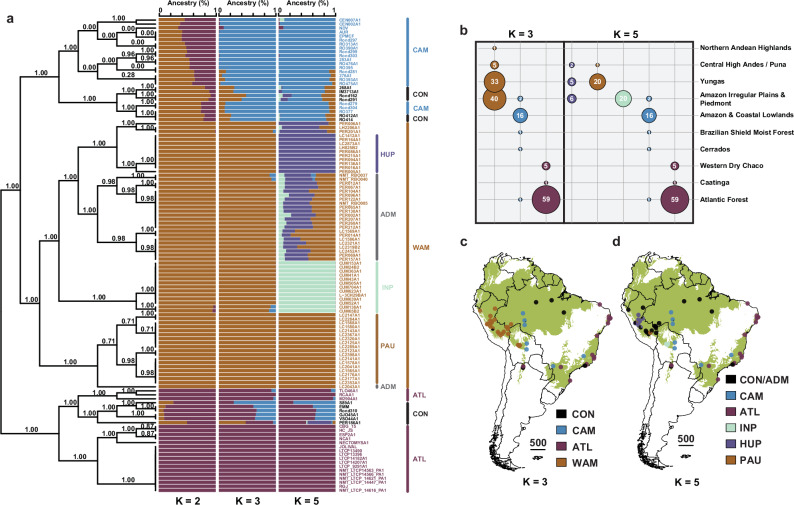
Fig. 3. Population genomic structure of L. braziliensis L1.
a ADMIXTURE barplots depicting the ancestry per isolate (Nunique = 116) assuming K = 2, K = 3, and K = 5 ancestral components. Isolates are labelled according to K = 3 ancestral components. Black is used for isolates with uncertain/hybrid ancestry (CON). Outer vertical lines show the major parasite groups (WAM, CAM, ATL, and CON) delineated by ADMIXTURE for K = 3. Inner vertical lines represent the parasite groups within WAM as inferred by ADMIXTURE for K = 5 in this study, which is in accordance with Heeren et al.23 (PAU, HUP, INP, and ADM). The left bound tree represents the population tree of L1 as inferred by fineSTRUCTURE. Branch support values represent the posterior probability for each inferred clade. b Sample size distribution per ancestral component per ecoregion (level 2) for all isolates with at least 85% ancestry to a specific group/population. Ecoregion data is available from: https://gaftp.epa.gov/EPADataCommons/ORD/Ecoregions/sa/. c, d Map of the South American continent showing the L1 population genomic structure, assuming K = 3 (c) and K = 5 (d) populations. The base map depicts the occurrence of (sub-) tropical moist broadleaf forests; data is available from: http://maps.tnc.org/gis_data.html. Country-level data were available from: https://diva-gis.org/data.html. CAM central Amazon, WAM west Amazon, ATL Atlantic, CON conglomerate, PAU Southern Peru, HUP central/northern Peru, INP central Bolivia, ADM admixed.

