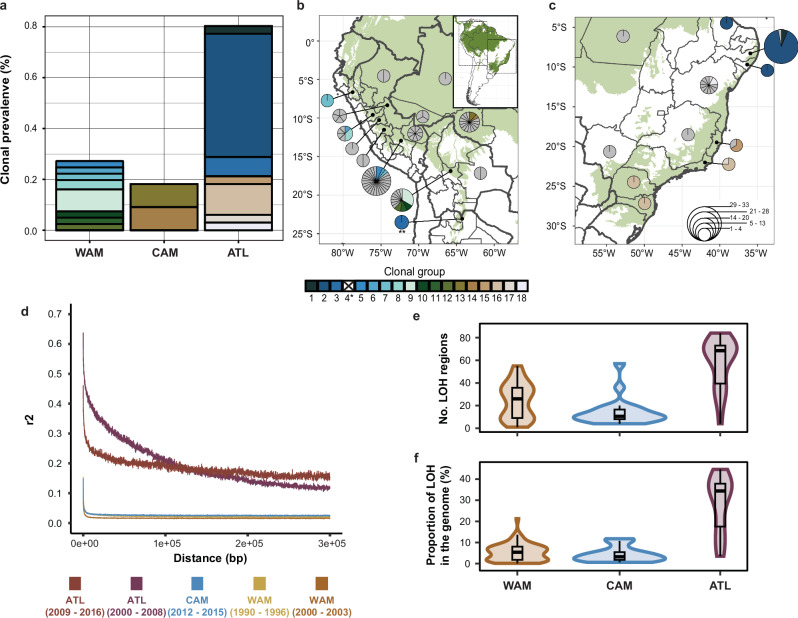
Fig. 5. Contrasting clonality and population structure in L. braziliensis L1.
a Clonal prevalence per population. b, c Distribution of genotypes in the Amazon and along the Atlantic coast, summarized per department/state of the respective country. The size of each pie indicates the number of genotypes found in each locality with each segment representing a unique genotype. Coloured segments indicate the different clonal groups that were identified. Note: *clonal group 4 is not included as it consists of two isolates of the CON group; **clonal group 3, located in Salta, Argentina belongs to ATL. d Linkage disequilibrium decay of the different L. braziliensis populations, accounting for spatio-temporal Wahlund effects and population size. e The number of loss-of-heterozygosity (LOH) regions per major population. f Proportion of LOH regions across the genome per major population. For panels (b, c) the base map depicts the occurrence of (sub-) tropical moist broadleaf forests; data is available from: http://maps.tnc.org/gis_data.html. Country-level data were available from: https://diva-gis.org/data.html.

