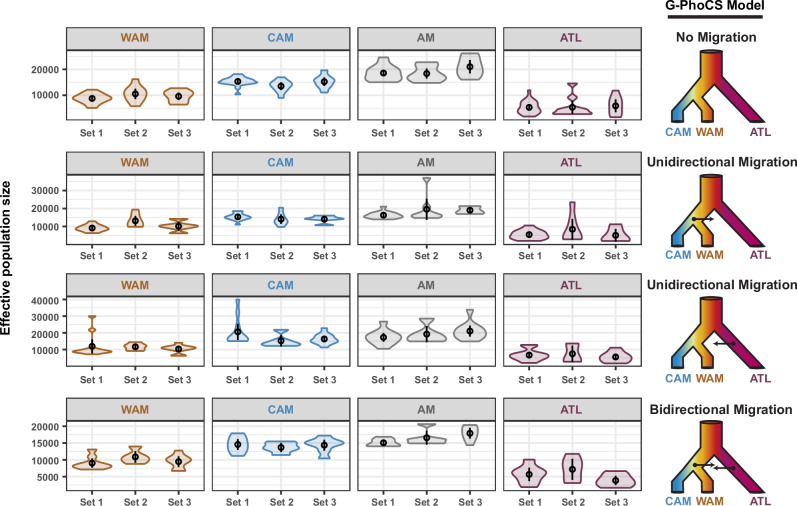
Fig. 6. Estimated effective population sizes (Ne) per population for four possible migration scenarios.
Each row depicts the Ne estimates per population for a given model of historical migration. WAM, CAM, and ATL represent the three major populations as inferred by ADMIXTURE and fineSTRUCTURE (Fig. 3a). AM represents the ancestral population prior to the split of WAM and CAM. Four models of historical migration were tested: (i) no migration, (ii) unidirectional migration from AM to ATL, (iii) unidirectional migration from ATL to AM, and (iv) bidirectional migration between AM and ATL.

