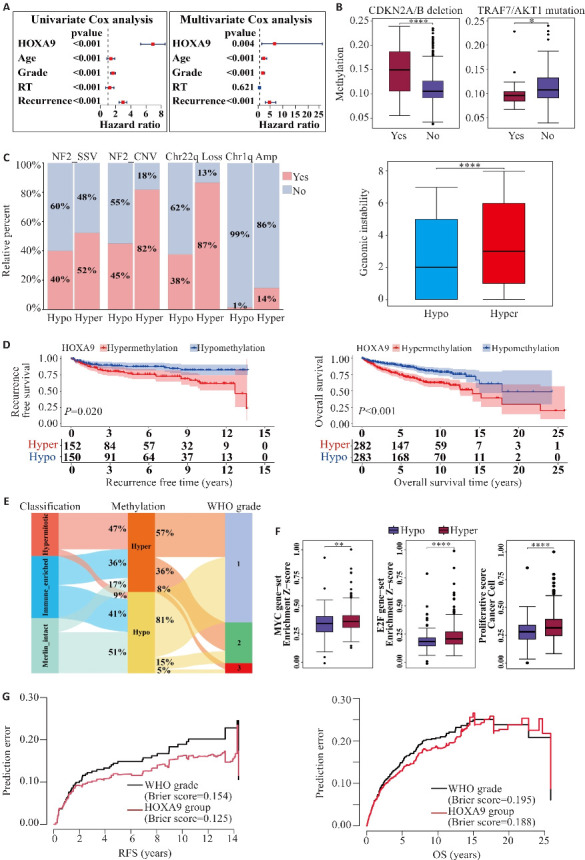
图2.

HOXA9甲基化与脑膜瘤临床特征相关性分析
Fig.2 Correlation analysis of HOXA9 methylation and clinical characteristics of meningioma. A: Univariate Cox analysis and multivariate Cox analysis of HOXA9 methylation and clinical characteristics with overall survival (OS) of meningioma patients. B: HOXA9 methylation difference in meningioma patients with CDKN2A/B deletion and TRAF7/AKT1 mutation. C: Proportion of meningioma patients with NF2-SSV, NF2-CNV, Chr22q Loss, and Chr1q Amp in hypomethylation (Hypo) and hypermethylation (Hyper) groups and box plot of the differences in gene instability. D: Kaplan-Meier survival curves for recurrence-free survival (RFS) and OS in Hypo and Hyper groups. E: Alluvial chart of Choudhury classification and WHO grade in Hypo and Hyper groups. F: Box plots comparing activation of molecular signatures of proliferation between HOXA9 groups. G: Brier prediction analysis of RFS and OS in HOXA9 groups and WHO grade in meningiomas. *P<0.05, **P<0.01, ****P<0.0001.
