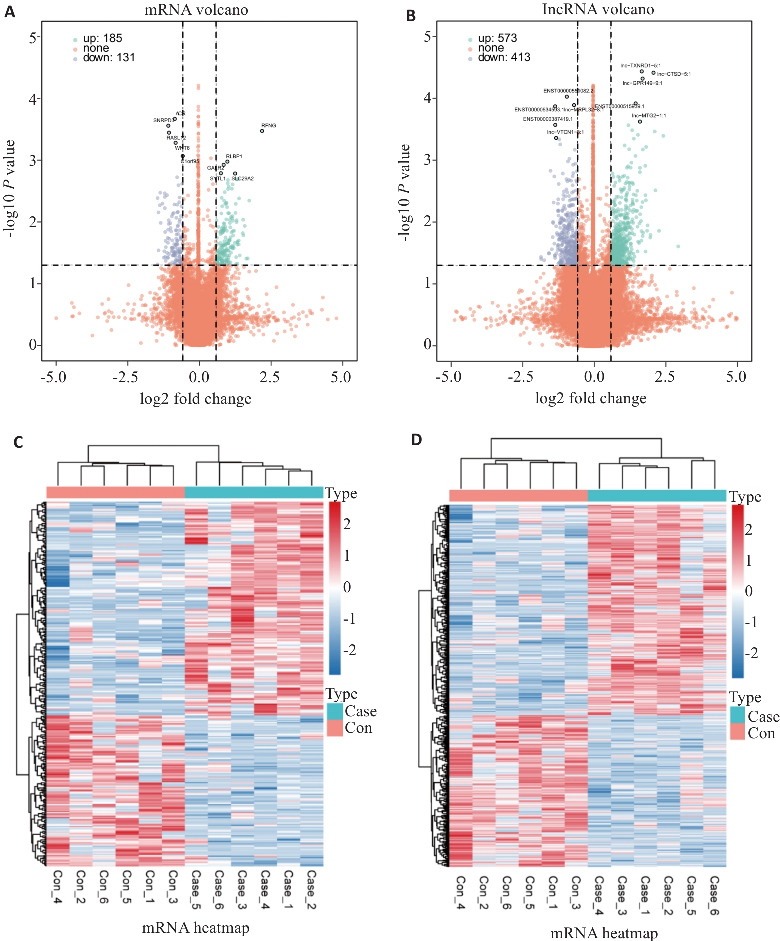
图1.

PD患者和健康对照的差异表达基因(DEGs)及lncRNA(DElncRNAs)
Fig.1 Differentially expressed genes (DEGs) and lncRNA (DElncRNAs) between PD and healthy individuals. A, B: Volcanic maps showing differences in plasma lncRNA and mRNA levels between PD patients and healthy control individuals. The significantly up-regulated DEmRNAs and DElncRNAs are shown in green, the significantly down-regulated DemRNAs are shown in blue, and those without significant differences are shown in orange. C, D: Cluster heat map showing all DEmRNAs and DElncRNAs in each sample.
