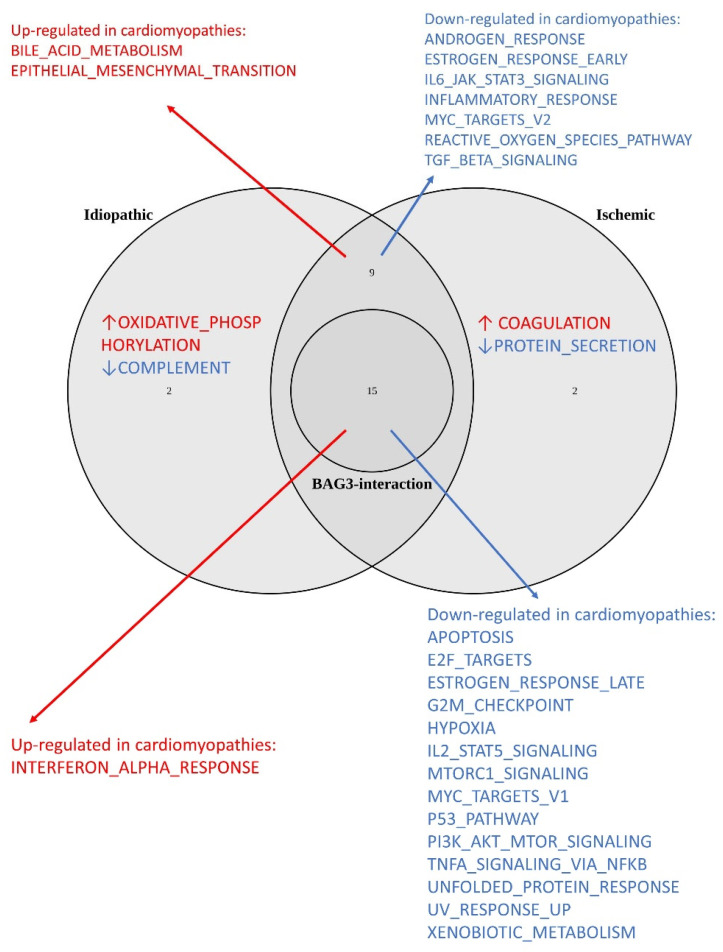
Figure 1.
Venn plot of hallmark gene sets enriched in cardiomyopathies and those with BAG3 interactions. The central circle represents 15 cardiomyopathy-related gene sets containing at least three BAG3-interacting proteins. Red arrows indicate upregulated gene sets, while blue arrows indicate downregulated gene sets.

