
Figure 2.
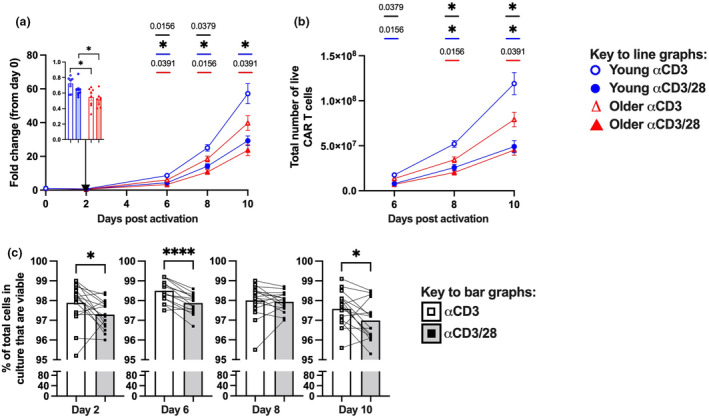
Impact of activation protocol and age on in vitro generation of CAR T cells. (a) Fold change in the number of total live leukocytes relative to day 0, with fold change at day 2 in the inset bar graph. (b) Total number of live CAR T cells recovered at the indicated day after activation. (c) Frequency of total cells that are viable at the indicated day after activation. Bars or symbols on the line graphs indicate mean ± SEM, and symbols on bar graphs indicate donors. *P ≤ 0.05 (c) or P ≤ 0.0125 (a, b) and **** P ≤ 0.0001 (c) using the Mann–Whitney U‐test (between donor groups) or pairwise Wilcoxon test (between activation protocols) with Bonferroni correction for multiple comparisons. (a, b) P ≤ 0.05 is indicated on the graphs in (a) and (b), where black bars indicate young vs older with the αCD3 mAb protocol, red bars indicate comparison of young with αCD3 vs αCD3mAb protocols, and blue bars indicate comparison of older with αCD3 vs αCD3mAb protocols.