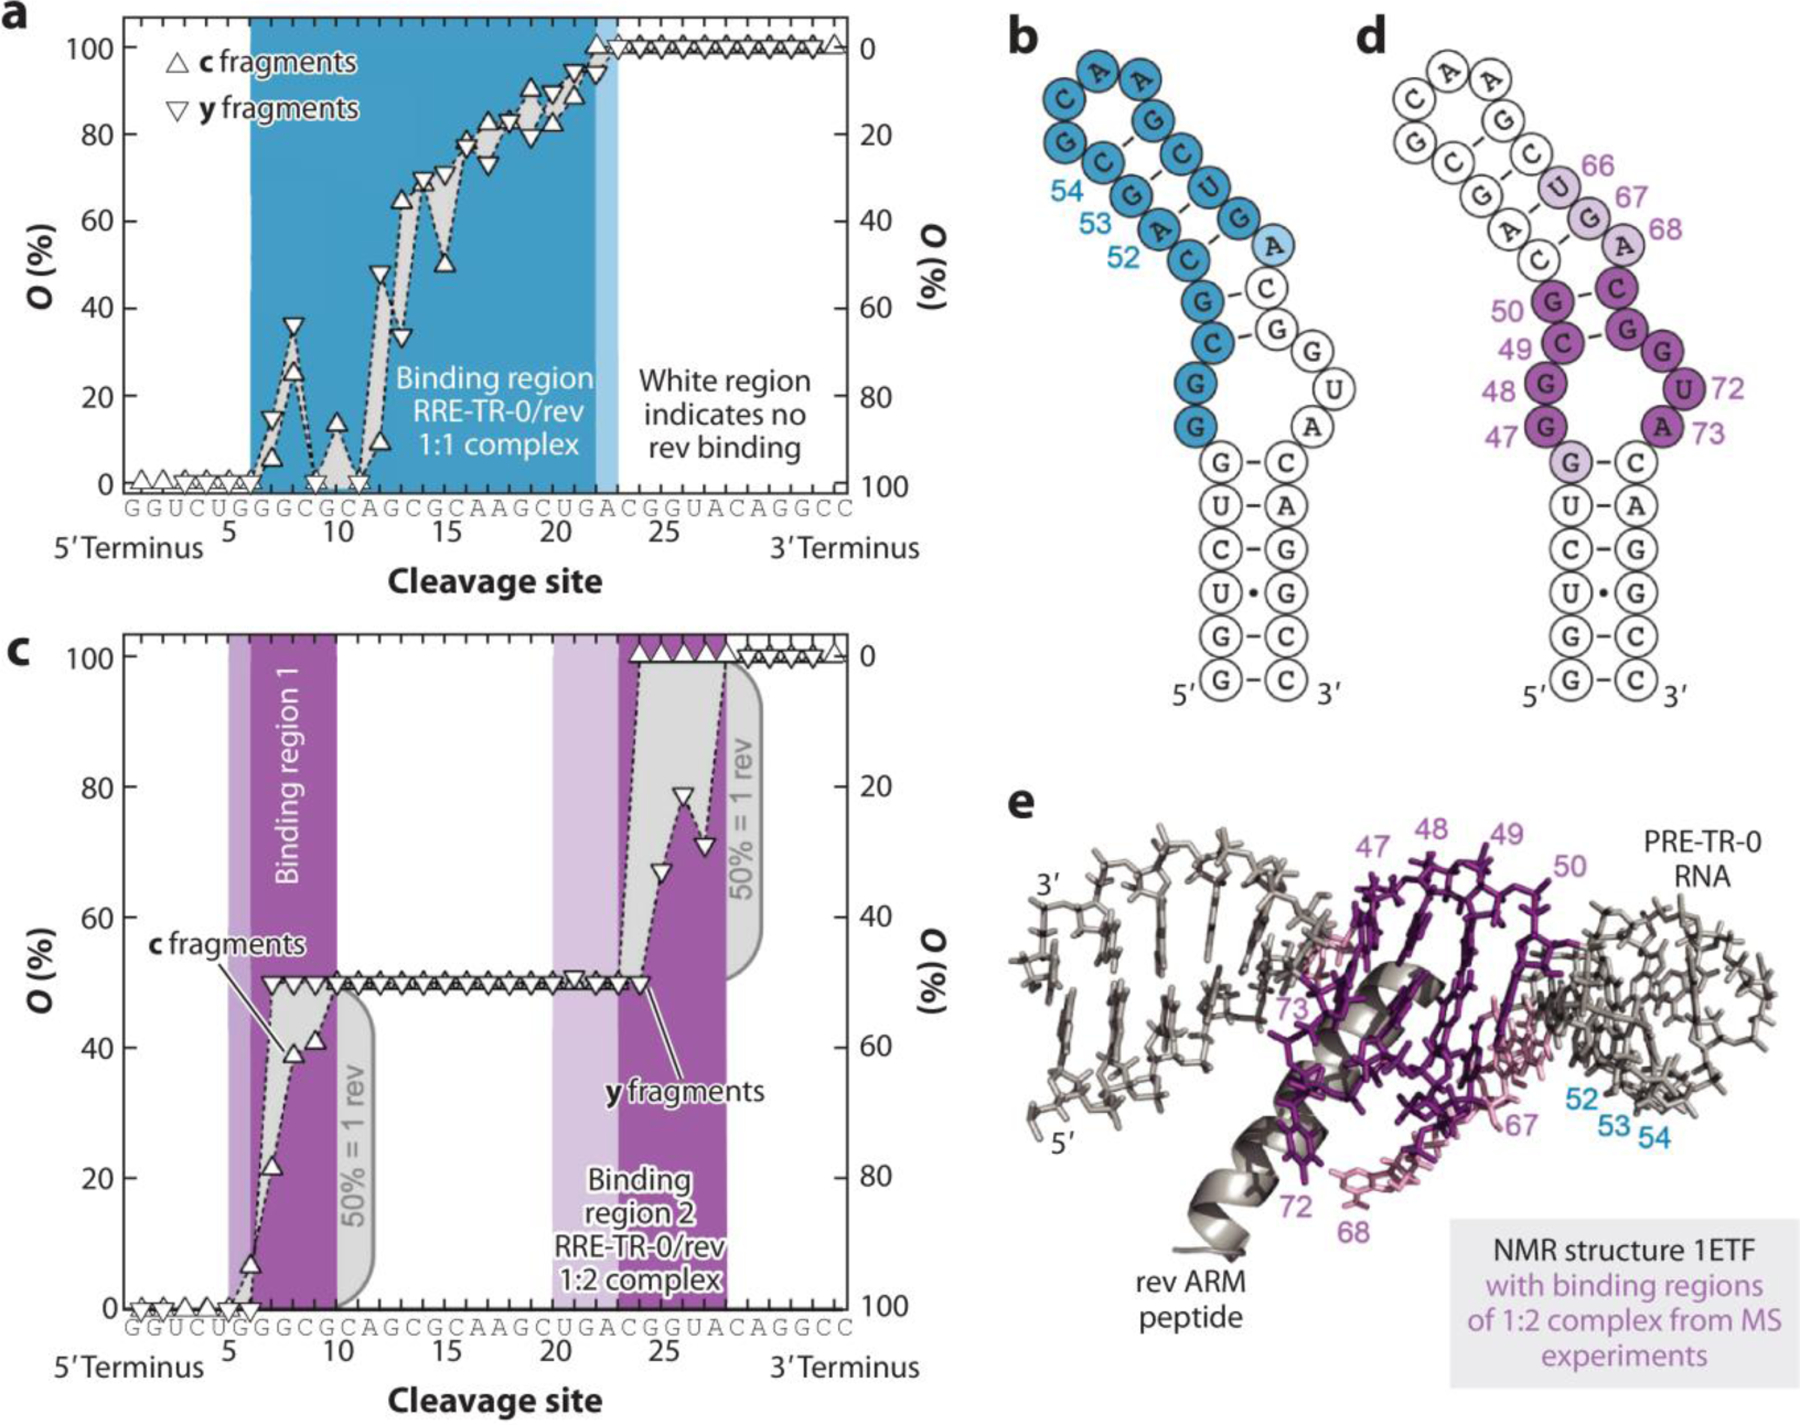
Figure 5. The use of native mass spectrometry to understand RNA binding.

Binding site mapping of RRE-TR- 0/rev complexes by CAD MS. (a) Site-specific occupancies (O) of c (left axis) and y (right axis) fragments with rev ARM peptide from CAD of 1:1 complex ions, (RRE-TR-0+ 1·rev - 14H)14−, at 137.2 eV and the corresponding binding region (blue) mapped onto the predicted secondary structure of RRE-TR-0 (b) show poor agreement with binding sites in the NMR structure (e). (c) Occupancies of fragments from CAD of 1:2 complex ions, (RRE-TR-0+ 2·rev - 14H)14−, at 175.5 eV and corresponding binding sites (violet) mapped onto the RRE-TR-0 structure (d) show good agreement with binding sites in the NMR structure (e). Darker and lighter colors in b, d, and e stand for stronger and weaker binding, respectively. Panel adapted with permission from Reference (91); copyright 2020 Nature Communications. Abbreviations: CAD, collision activated disassociation mass spectrometry; ARM, arginine-rich motif; NMR, nuclear magnetic resonance.
