
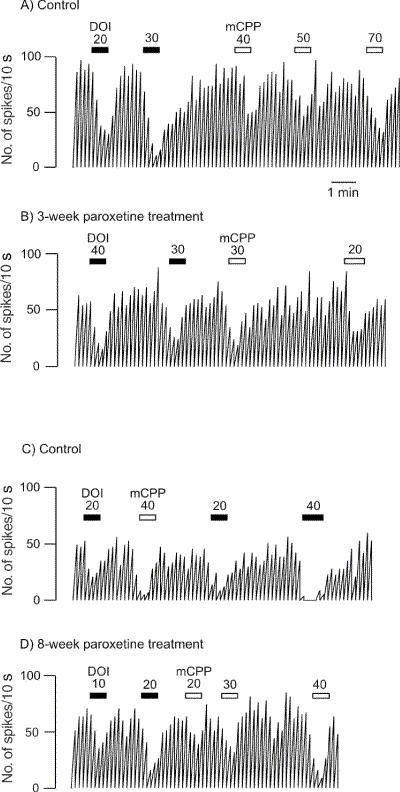
Fig. 2: Integrated firing rate histogram of an orbitofrontal cortex neuron, showing its responsiveness to microiontophoretic application of DOI and mCPP in control animals and rats treated with paroxetine for 3 and 8 weeks. Horizontal bars indicate the duration of the applications (currents given in nanoamperes). The time base in A applies to all traces. Traces in the control and the treated rats were obtained from animals from the same shipment that were treated simultaneously after administration of vehicle or paroxetine. These traces were all obtained on the same day.