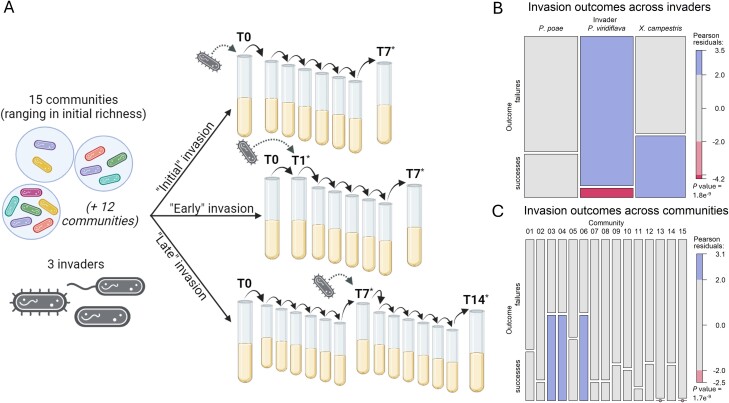
Figure 1.
Experimental design and invasion outcomes across invaders and communities: (A) 15 bacterial communities were separately subjected to invasion by three bacterial isolates across three timing treatments. Across all treatments, passaging always occurred after 24 h and involved a 1:100 dilution into fresh media. In the “initial invasion” treatment, a given invader was added alongside the other community members at the time of community initiation (T0). In the “early invasion” treatment, a given community was assembled and passaged after 24 h (T1), before an invader was added immediately after passaging. And in the “late invasion” treatment, a given community was assembled and passaged for 7 days (T7) before an invader was added. Post-invasion, communities were passaged for 7 days and characterized using shallow short-read sequencing. Sequenced samples are indicated by (*). Figure created with BioRender.com. (B) Mosaic plot representing successful and failed invasions for each invader. Invasion outcome was defined as a “success” (bottom box) if the invader persisted over time or a “failure” (top box) if the invader was ultimately excluded. Chi-square test of independence shows invader identity was significantly associated with invasion success (P value 1.79e−9). (C) Mosaic plot representing successful and failed invasions in each community. Chi-square test of independence shows community identity was significantly associated with invasion success (P value 1.69e−9). Significantly over- or under-represented outcomes are highlighted. Pearson residuals >2 or <−2 indicate a count value >2 SD from the expectation.

