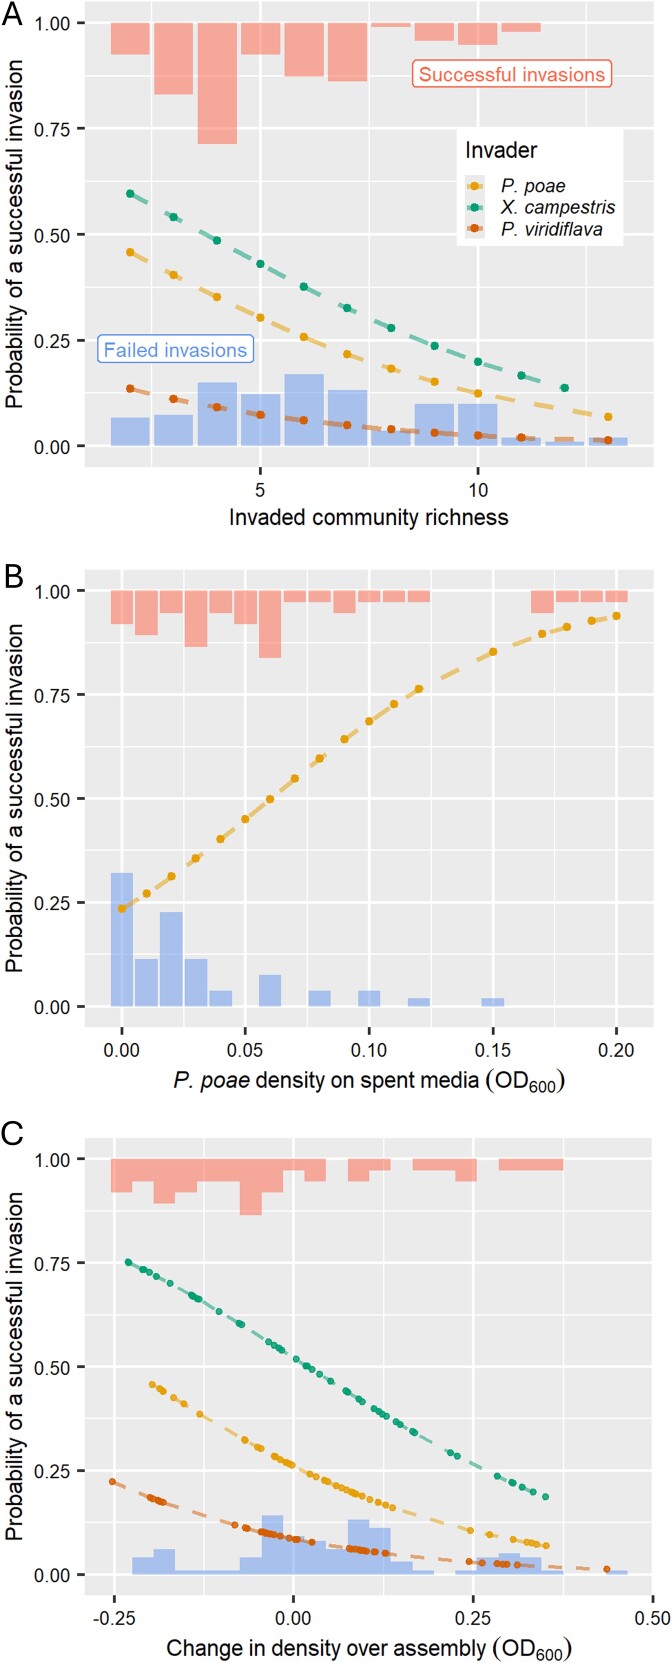
Figure 2.
Invaded community richness and estimates of community resource use efficiency were predictive of invasion outcome: plots depicting the results of logistic regressions analyzing the relationship between invasion outcome (success/failure) with (A) the richness of an invaded community measured immediately prior to invasion, (B) the growth (optical density) of the invader Pseudomonas poae (MEJ082) on spent media, and (C) the change in density between day 1 and day 6 of the “late invasion” communities prior to invasion. Proportional histograms at the top and bottom of each plot represent the observed distributions of invaded community richness, density, or change in density, partitioned by invasion outcome (bottom = failed invasion, top = successful invasion). The dotted lines represent the fitted relationship of each model for each invader considered in the analysis.

