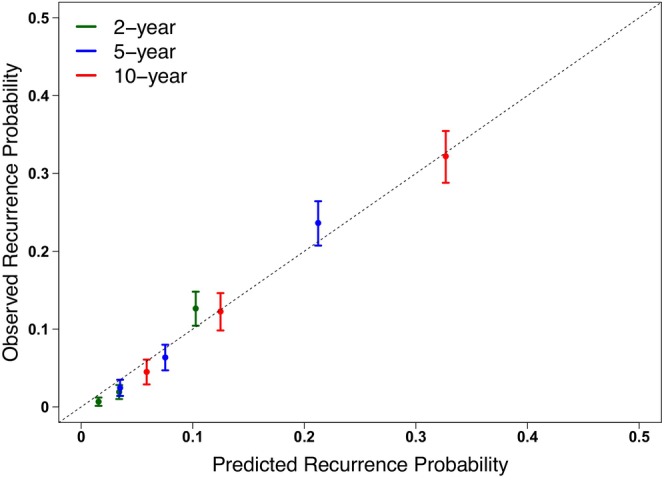
FIGURE 2.

Calibration curve with 95% CIs comparing observed (actual) and predicted recurrence probabilities for the entire study cohort. The dotted gray line indicates a perfect calibration model in which the predicted recurrence probabilities are identical to the actual recurrence proportions.
