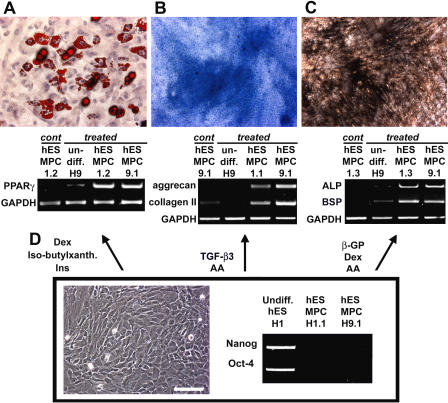
Figure 2. Selective Differentiation of hESMPCs into Various Mesenchymal Derivatives.
(A) Adipocytic differentiation in the presence of dexamethasone, insulin, and isobutylxanthine. Adipocytic characterization by Oil Red O staining and RT-PCR analysis for PPARγ.
(B) Chondrocytic differentiation in the presence of TGF-β3 and ascorbic acid. Chondrocytic characterization by Alcian Blue staining and RT-PCR for aggrecan and collagen II.
(C) Osteogenic differentiation in the presence of β-glycerolphosphate, dexamethasone, and ascorbic acid. Osteocytic characterization by von Kossa staining and RT-PCR for bone-specific alkaline phosphatase (ALP) and bone sialoprotein (BSP).
(D) Phase-contrast image of hESMPCs and RT-PCR for the ES cell markers Nanog and Oct-4 in hESMPC-H1.1 and -H9.1 compared with undifferentiated H1 hESCs.
Scale bar = 50 μm for all panels.

