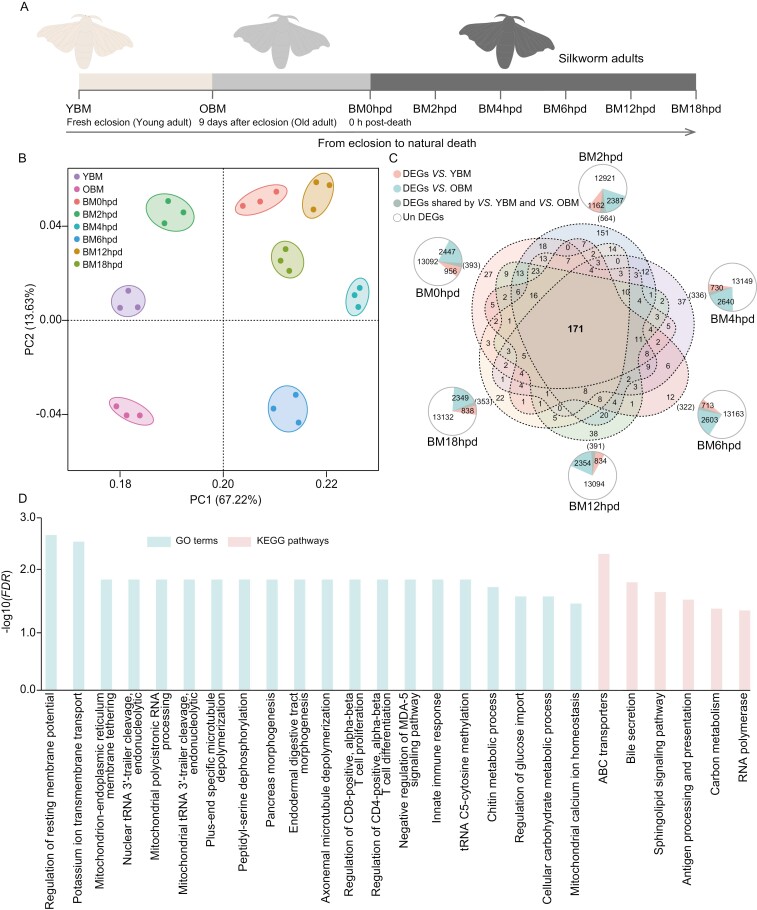
Fig. 1.
DEGs in adult silkworm post-mortem. a) A flow diagram illustrating the sampling process. YBM freshly emerged from pupae. OBM: old silkworm. BM0hpd, BM2hpd, BM4hpd, BM6hpd, BM12hpd, and BM18hpd represent silkworm collected post-mortem at 0, 2, 4, 6, 12, and 18 h post-death, respectively. b) PCA plot showing the clustering of the RNA-seq libraries from the different stages. c) Summary of the number of DEGs across the various stages. The area of the sector in the circle represents the number of genes. d) Enriched GO terms (light green) and KEGG pathways (pale pink) significantly (FDR < 0.05) associated with the CPRGs.

