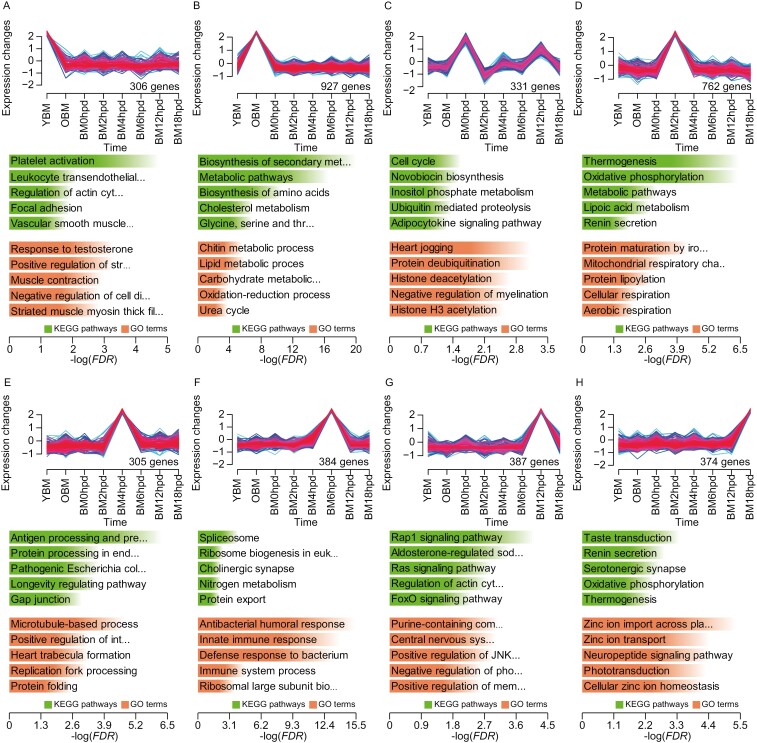
Fig. 2.
TSGs in silkworm. Time-specific gene clusters at YBM a), OBM b), BM0hpd c), BM2hpd d), BM4hpd e), BM6hpd f), BM12hpd g), and BM18hpd h), respectively. The number of genes assigned to each cluster is presented in the lower right position in each coordinate. Histograms indicate the top 5 significantly enriched KEGG pathways and GO terms, with significance levels presented as green and orange bars, respectively.

