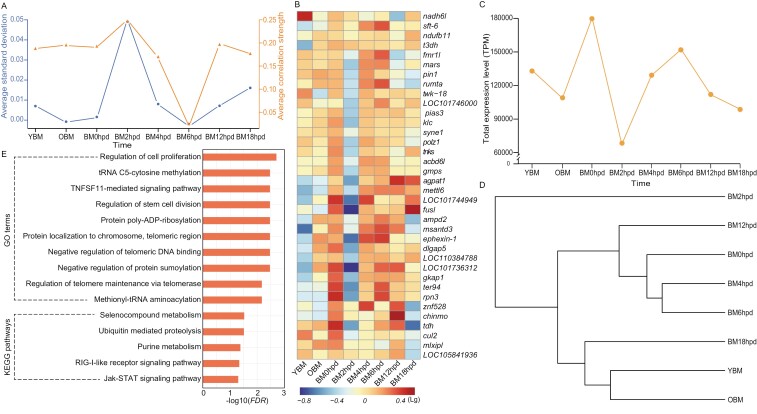
Fig. 3.
DNB genes. a) Critical transition events for global gene expression. b) A heatmap of DNB genes. c) Line chart and d) cluster dendrogram of the total expression level TPM of the DNB genes across time points. e) Enriched GO terms and KEGG pathways associated with the DNB genes, with significance levels presented as orange bars. Detailed information of the DNB genes is presented in Supplementary Table S10.

