Fig. 1.
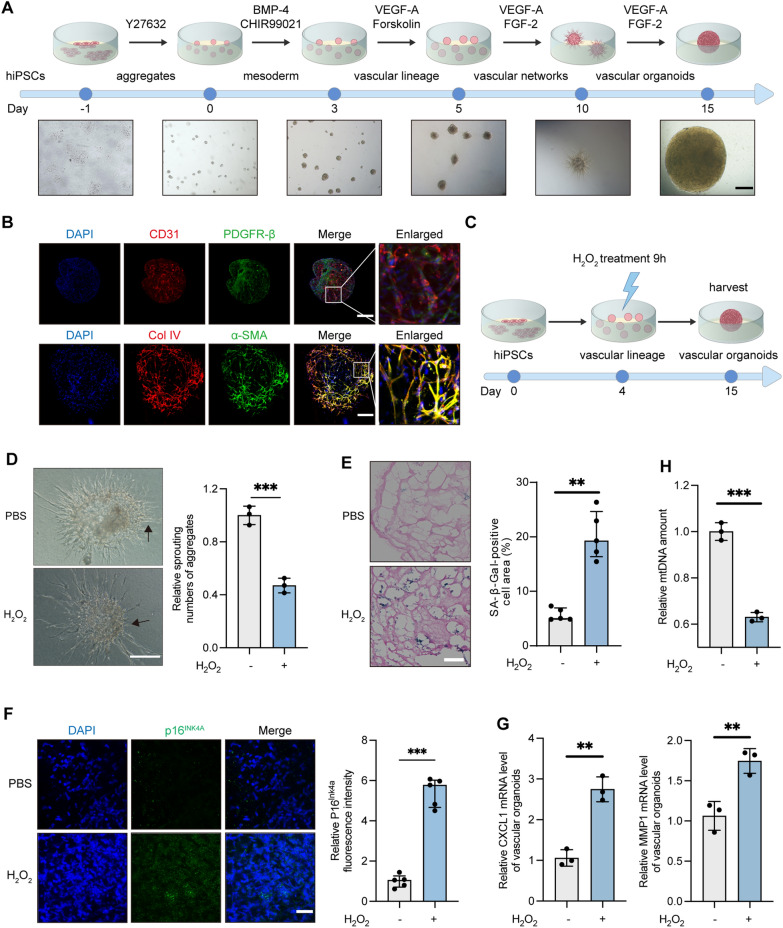
ROS impairs VO development and induces cell senescence. A Schematic timeline and landmark stages of VO development from hiPSCs: aggregates (day 0), mesoderm (day 3), vascular lineage (day 5), vascular networks (day 10), and VOs (day 15). Scale bar, 450 μm. B IF of VOs. CD31 (red) labels endothelial cells, PDGFR-β (green) labels mural cells, Col IV (red) labels the basement membrane, α-SMA (green) labels vascular smooth muscle cells, and DAPI (blue) stains nuclei. Scale bar, 250 μm (day 15). C Schematic timeline for H2O2 treatment of VOs: 50 μM H2O2 was applied for 9 h at the vascular lineage stage (day 4). D Microscopic images of VOs (day 10) after treatment with 50 μM H2O2 or PBS for 9 h at the vascular lineage stage. Arrows indicate neovascular sprouting. Relative sprouting counts were analyzed using ImageJ. Scale bar, 250 μm. E SA-β-Gal staining of VOs (day 15). The percentage of SA-β-Gal-positive cells was calculated as the area of SA-β-Gal staining (blue) relative to eosin-stained area (red). The values were obtained from five randomly selected fields. Scale bar, 50 μm. F IF of VOs showing p16INK4a (green) as a marker of senescent cells, with DAPI (blue) staining nuclei. Scale bar, 60 μm. Relative p16INK4a fluorescence intensity was quantified from five randomly selected fields. G Relative SASP (CXCL1, MMP1) levels in VOs assessed by RT-qPCR. H Relative mtDNA content in VOs measured by RT-qPCR. (ns, not significant; **P < 0.01; ***P < 0.001)

