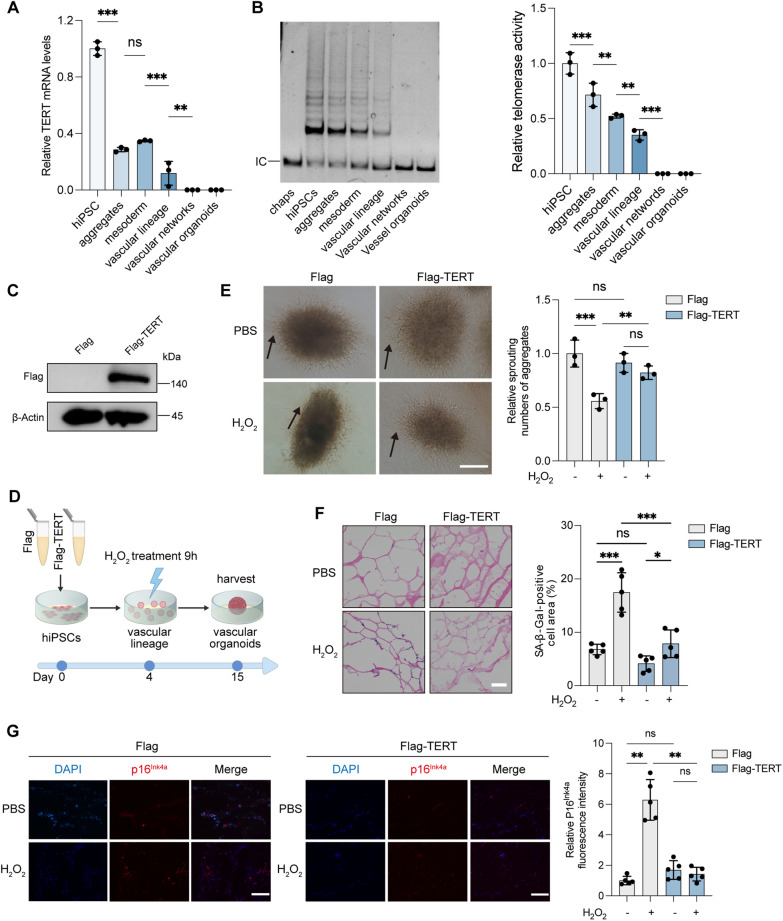
Fig. 3.
TERT alleviates ROS-induced impairment and senescence in VOs. A Relative TERT mRNA levels in VOs during development, measured by RT-qPCR. B Telomerase activity assessed by the telomerase repeat amplification protocol (TRAP). CHAPS lysate served as a negative control. C Western blot analysis of Flag levels in hiPSCs. D Schematic timeline of H2O2 treatment in VOs. E Microscopic images of VOs (day 10) following 50 μM H2O2 or PBS treatment. Arrows indicate neovascular sprouting. Scale bars, 250 μm. F SA-β-Gal staining of VOs (day 15). Scale bars, 50 μm. The percentage of SA-β-Gal-positive cell area (blue) relative to eosin-stained area (red) was calculated from five random fields. G IF of VOs for p16INK4a (red) and DAPI (blue) staining. Scale bars, 50 μm. Relative p16INK4a fluorescence intensity was calculated from five random fields. (ns, not significant; *P < 0.05; **P < 0.01; ***P < 0.001)

