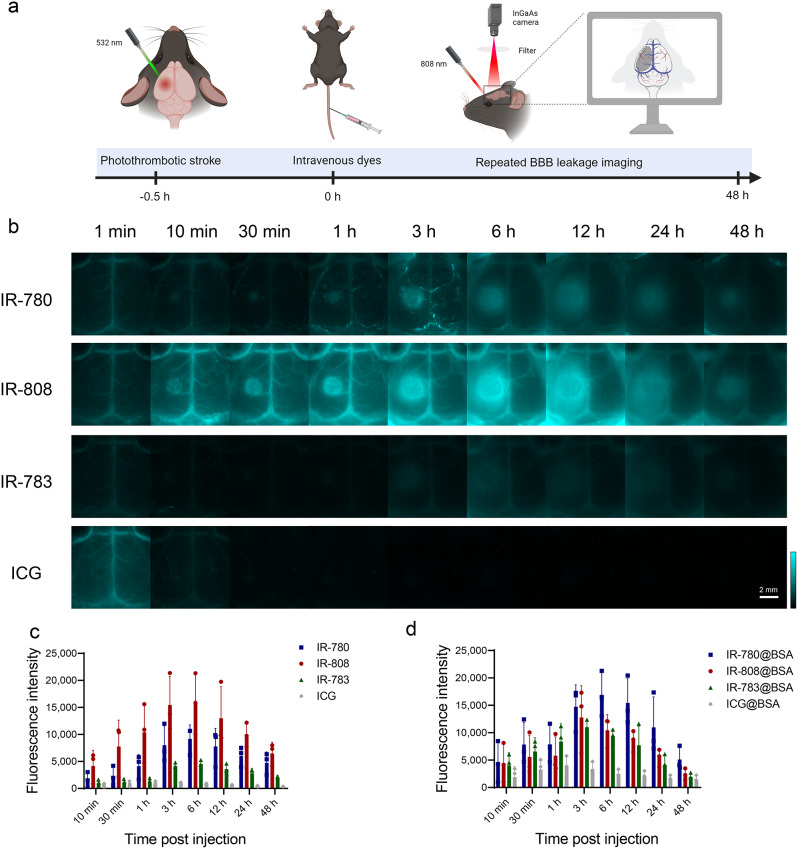
Fig. 3.
Albumin-seeking dyes real-time monitoring BBB disruption in mice with stroke. (a) Schematic diagram of photothrombotic stroke model and NIR-II imaging for BBB disruption monitoring post-stroke (Created with BioRender.com). (b) NIR-II dynamic imaging (40 ms, 1100 LP) recorded at indicated time points post-injection of stroke mice with IR-780, IR-808, IR-783, and ICG (50 µM, 60 µL). (c-d) Difference in fluorescence signal intensity on the left and right sides post-injection of free dyes and dye@BSA (mean ± SEM, n = 3 for each group)

