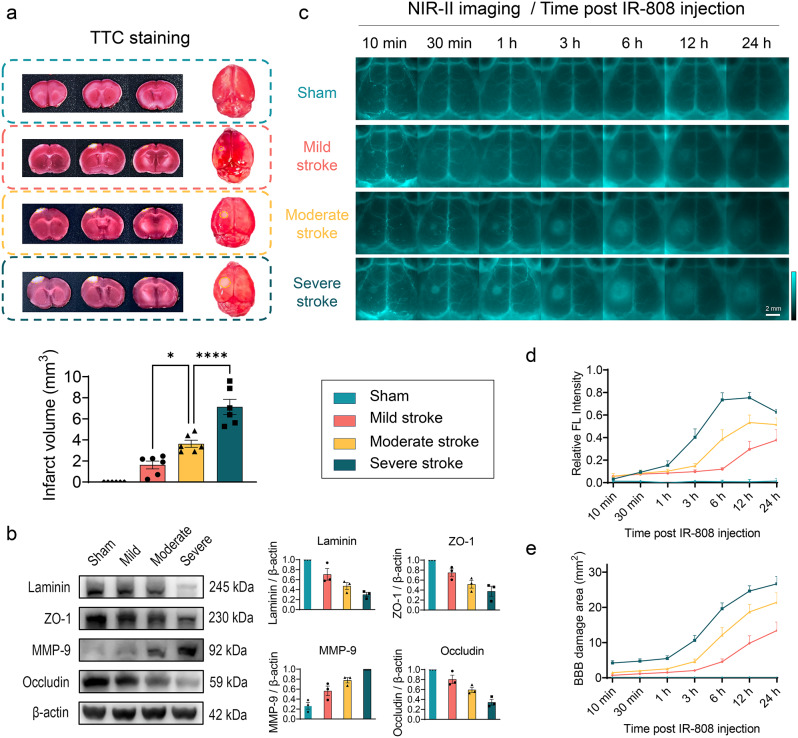
Fig. 4.
IR-808 dynamic monitoring of BBB disruption with varying severity. (a) Coronal slices and whole-brain TTC staining in sham, mild, moderate, severe stroke groups and statistical analysis of infarct volumes quantified in slices (mean ± SEM, n = 6 for each group). (b) Western blotting analysis of BBB injury protein expression in the brains of mice with stroke with incremental severity (mean ± SEM, n = 3 for each group). (c) IR-808 NIR-II imaging for in vivo multi-timepoint monitoring of BBB disruption in strokes of different severity (40 ms, 1100 LP). (d) Quantification of the relative FL intensity (Ratio of fluorescence intensity of affected side/healthy side-1) at time post-injection (n = 6 for each group). (e) Quantification of the area of fluorescence signal accumulation in the BBB damage area at time post-injection (n = 6 for each group). *P < 0.05, ****P < 0.0001

