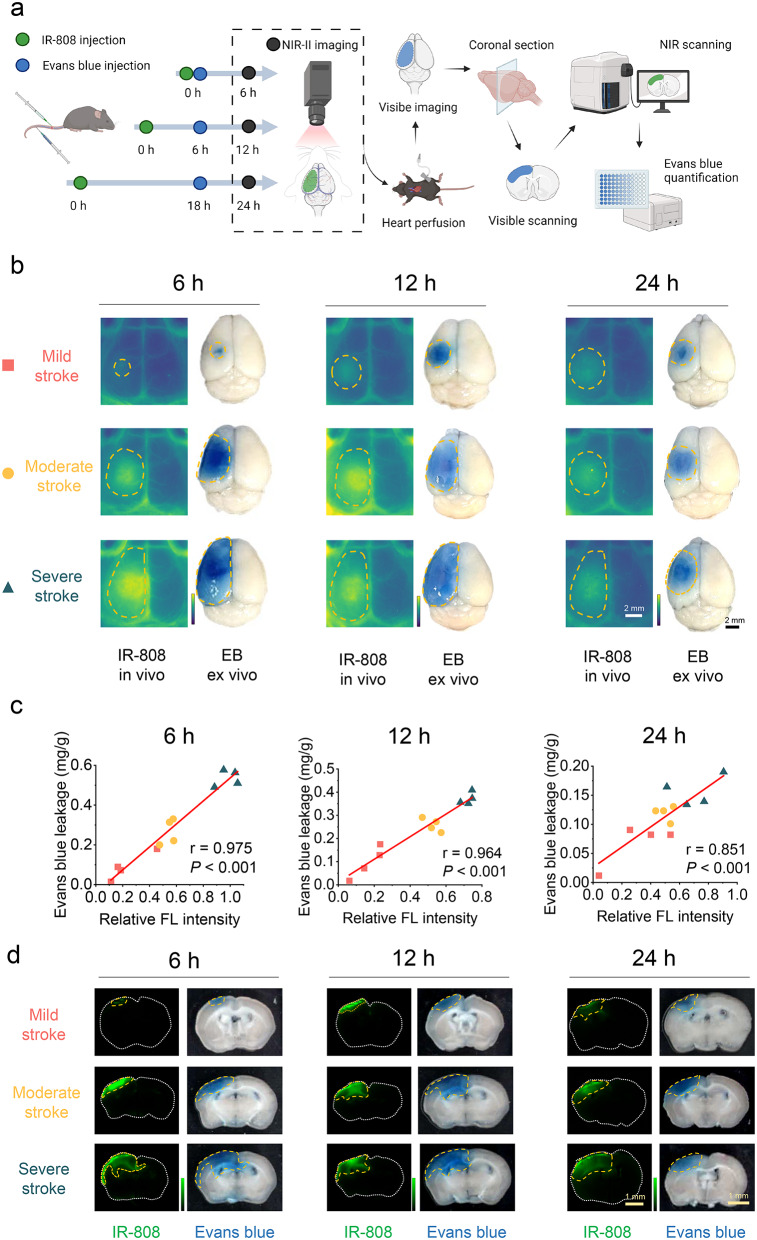
Fig. 5.
Correlation of IR-808 with Evans blue evaluation of BBB injury. (a) Schematic diagram showing the quantification of IR-808 and Evans blue (EB) on BBB disruption evaluation in the same mice (Created with BioRender.com). (b) IR-808 in vivo NIR-II imaging and its ex vivo visible EB imaging in mice with mild, moderate, and severe stroke at 6 h, 12 h, and 24 h. Orange dotted line outlines BBB leakage areas. (c) Correlation of relative FL intensity of IR-808 with Evans blue quantification at 6 h, 12 h, and 24 h (n = 12 each time point). (d) The corresponding images of brain sections under NIR and visible scanning in panel b

