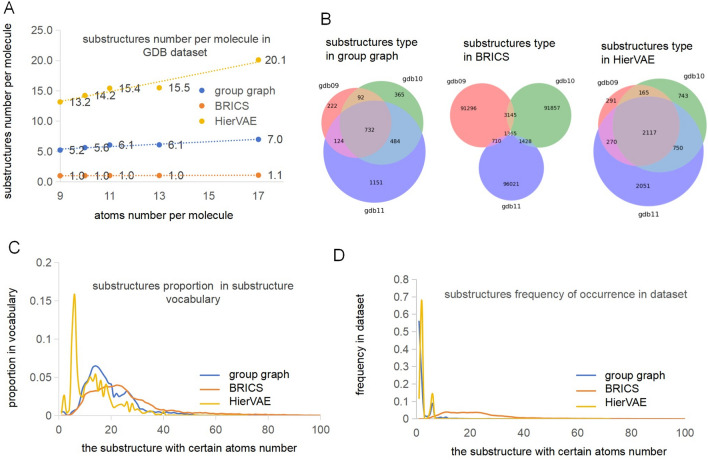
Fig. 4.
Characteristics of substructures from different datasets and in three types of substructure groups. A The substructures number per molecule in the group graph, the substructure graph of BRICS and HierVAE, from GDB9, GDB10, GDB11, GDB13 and GDB17; B The substructure types in the group graph, the substructure graph of BRICS and HierVAE, from GDB9, GDB10 and GDB11; C The proportion of the substructure with same atoms number to size of the substructure vocabulary from natural products dataset, in the group graph, the substructure graph of BRICS and HierVAE; D The frequency of occurrence of substructures with same atoms number in the natural products dataset, in the group graph, the substructure graph of BRICS and HierVAE [33]. The proportion of the substructure with same atoms number in the substructure vocabulary and the frequency of occurrence of substructures with same atoms number in the dataset are explained in the supporting information

