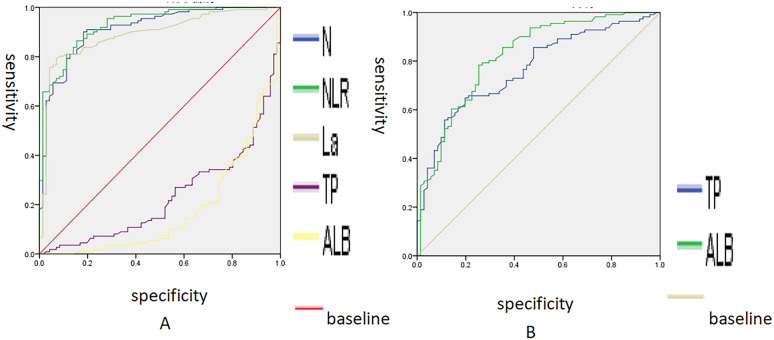
Fig. 1.
ROC curve analysis of N%, NLR, La, TP and ALB. A A larger test result indicates a more positive test; B smaller test results indicate a more positive test. A Orange solid line—La; purple solid line—TP; black solid line—ALB; steel blue solid line—N; green solid line—NLR; red solid line—baseline. B Steel blue solid line—TP; green solid line—ALB; orange solid line—baseline. X-axis: specificity; Y-axis: sensitivity; scale: the range for both the x-axis (specificity) and the y-axis (sensitivity) extends from 0.0 to 1.0, representing 0% to 100%. AUC area under the receiver operating characteristic curve

