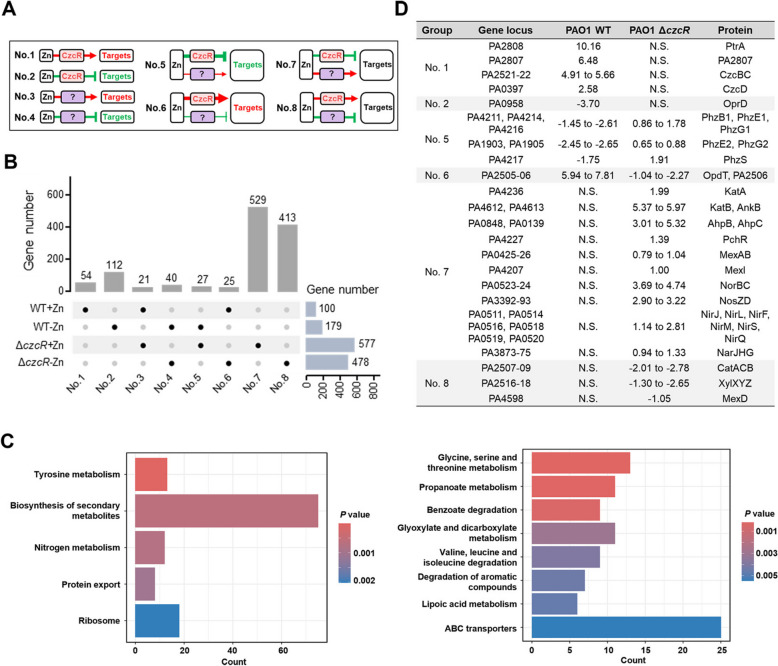
Fig. 2.
Global gene regulation by CzcR-dependent and -independent pathways during Zn excess. A A diagram showing eight groups of target genes that were regulated by Zn in CzcR-dependent or/and CzcR-independent pathways. Question marks indicate unclear factors involved in the pathways. Red arrows and green T-shaped symbols indicate upregulation and repression, respectively. Targets highlighted in red indicate genes that are upregulated by Zn in the WT strain, targets highlighted in green indicate genes that are downregulated by Zn in the WT strain, targets in black indicate genes whose expression is not changed by Zn in the WT strain. B An UpSet plot showing the distribution of DEGs within eight groups as shown in (A). C KEGG pathway enrichment of genes that were present in the groups No.7 (left) and No.8 (right). D Representative target genes in groups No.1, 2, 5, 6, 7 and 8 were presented

