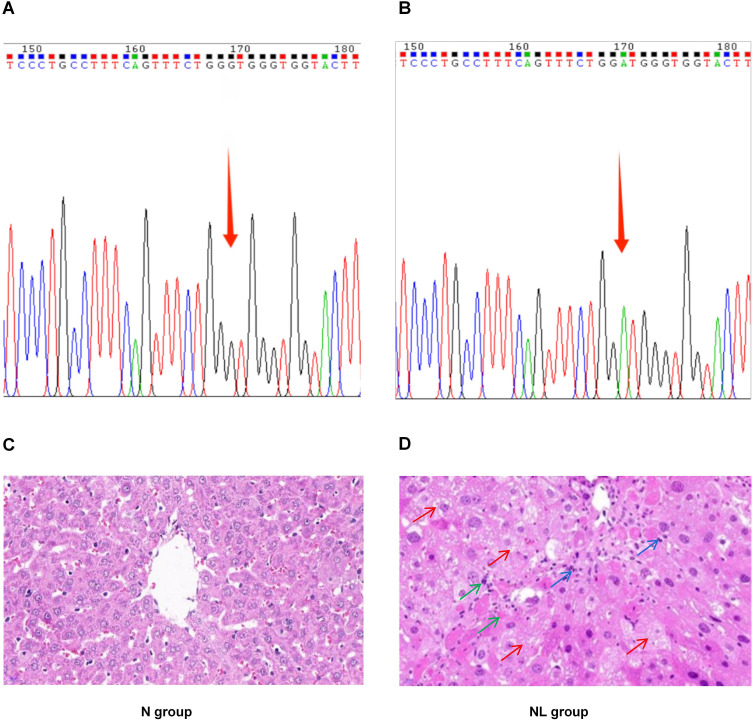
Figure 2.
Genotyping Analysis and Histopathological Assessment of Liver Tissue in TX Mice. (A) Genetic Profile of the N Group Mice; (B) Genetic Profile of the NL Group Mice; (C) Histopathological Findings in the Liver of N Group Mice (×400); (D) Histopathological Findings in the Liver of NL Group Mice (×400). Red arrow, cellular edema and degeneration; Green arrow, cell necrosis; Blue arrow, infiltration of inflammatory cells.

