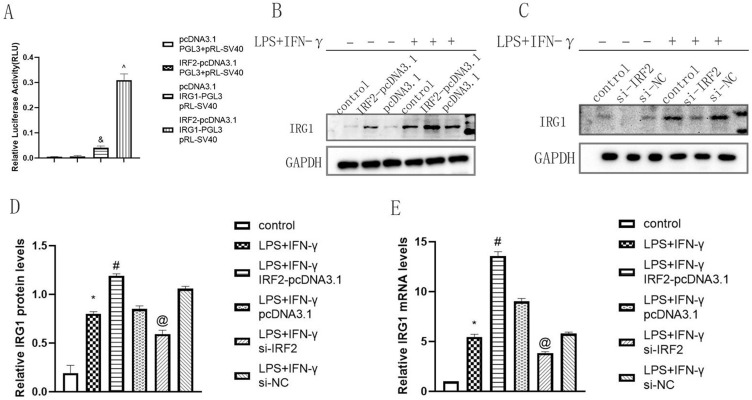
Figure 4.
IRG1 was a direct target of IRF2. The luciferase activity of IRG1 promoter (A), Representative Western blot bands of IRG1 (B and C) and relative protein and mRNA levels of IRG1 were normalized to that of the GAPDH internal control (D and E) when IRF2 was overexpressed and silencing; Mean±standard error of the mean values is presented for each group. and: pcCDNA3.1+IRG1-PGL3+pRL-SV40 group compared with pcDNA3.1+PGL3+pRL-SV40 group and IRF2-pcDNA3.1+PGL3+pRL-SV40 group, P < 0.05; ^: IRF2-pcDNA3.1+IRG1-PGL3+pRL-SV40 group compared with pCDNA3.1+IRG1-PGL3+pRL-SV40 group, P < 0.05; *: LPS+IFN-γ group compared with control group, P < 0.05; #: LPS+IFN-γ+IRF2-pcDNA3.1 group compared with LPS+IFN-γ group and LPS+IFN-γ+pcDNA3.1 group, P < 0.05; @: LPS+IFN-γ+si-IRF2 group compared with LPS+IFN-γ group and LPS+IFN-γ+si-NC group, P < 0.05. P < 0.05 by one-way analyse of variance (ANOVA). Control group was defined as RAW264.7 cells without LPS+IFN-γ treated group.

