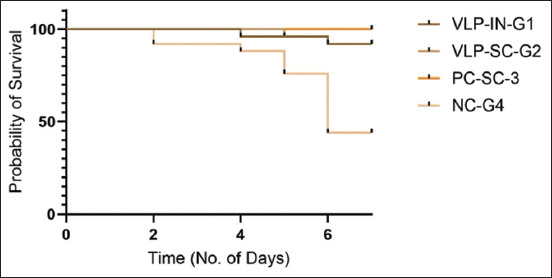
Figure-11.

Survival curve was generated using Kaplan–Meier plot and Mantel–cox log-rank test showed a significant difference in the survival of animals in different groups (p < 0.0001). The survival curve was generated to assess the protective efficacy of the vaccine against viral challenge. Broiler birds were divided into four groups. The survival curve plots the percentage of surviving animals on the y-axis as a function of time on the x-axis. The vaccinated group’s curve showed a significant separation from the control group. The slope of the survival curve for the vaccinated groups was flatter, indicating a lower rate of death compared with the control group.
