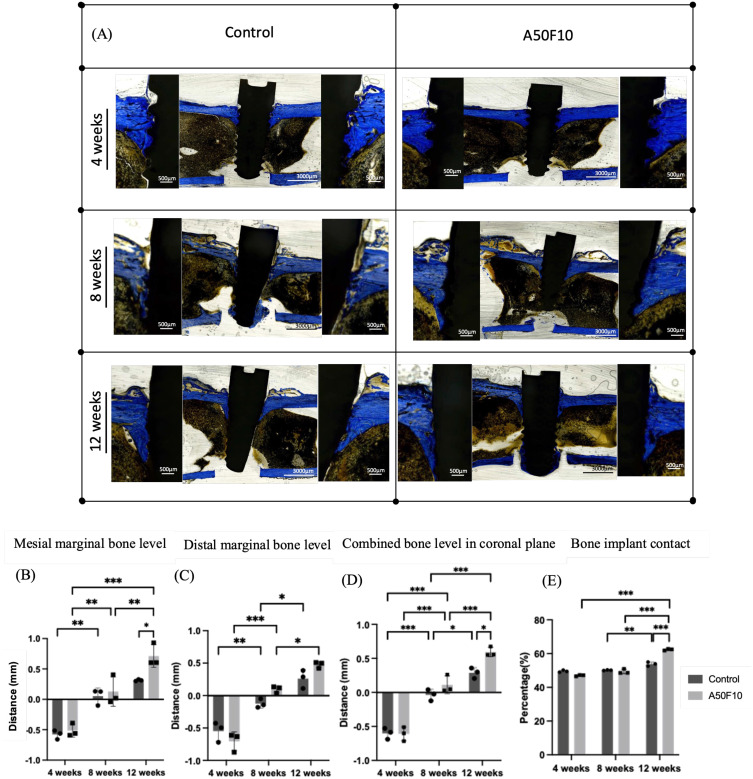
Figure 9.
(A) Histological sections of control and A50F10 group demonstrating increase marginal bone level. Histomorphometric analysis data indicating (B) Mesial, (C) Distal and (D) Combined bone level in coronal section, and (E) Illustrating percentage of bone implant contact.
Notes: *P < 0.05, **P < 0.01, and ***P < 0.001.

