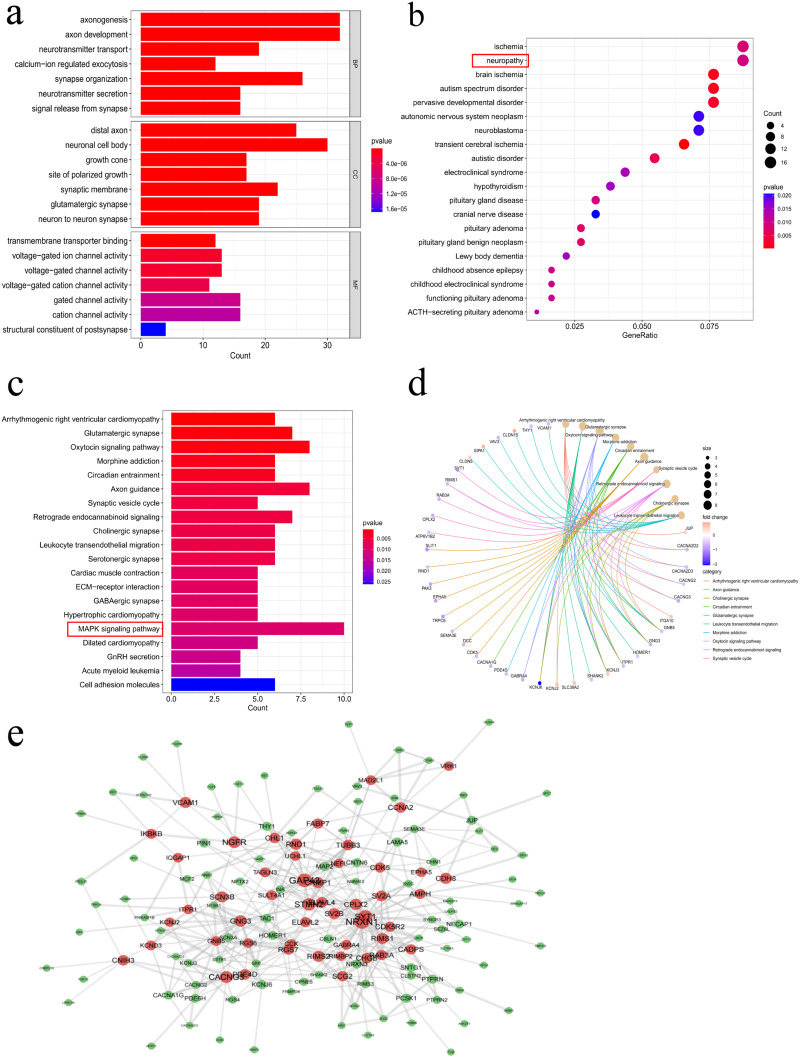
Figure 3.
Functional enrichment analysis. (a) Venn diagram showing intersection of DEGs and WGCNA-derived candidate feature genes. (b) Gene Ontology (GO) enrichment analysis of DEGs categorized into biological process (BP), cellular component (CC), and molecular function (MF). (c) Disease Ontology (DO) analysis revealing diseases associated with candidate genes. (d and e) KEGG pathway enrichment analysis highlighting pathways involving candidate feature genes. (f) Protein-protein interaction (PPI) network analysis of candidate feature genes in PD, indicating significant protein interactions.

