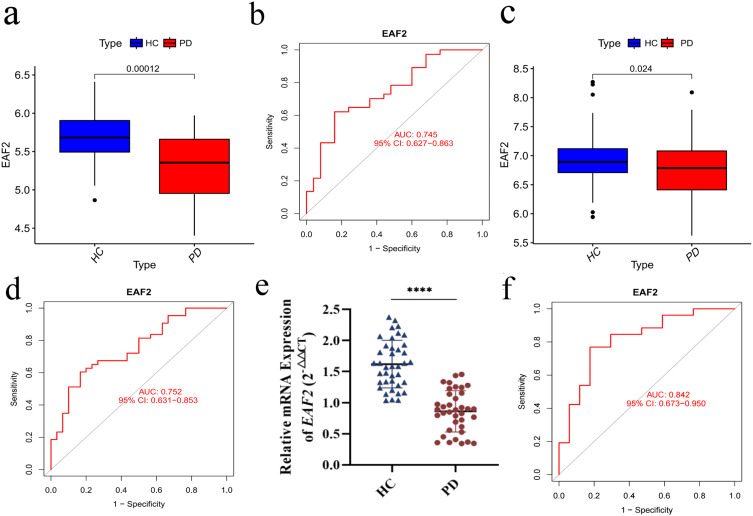
Figure 5.
Gene expression and diagnostic efficacy. (a) RT-qPCR results demonstrating reduced EAF2 expression in PD based on experimental dataset. (b) ROC curve showing diagnostic value of EAF2 in PD based on experimental dataset (AUC = 0.745). (c) Decreased EAF2 expression observed in PD validation dataset. (d) Diagnostic performance of EAF2 in validation dataset (AUC = 0.752). (e) Significant downregulation of EAF2 in peripheral blood samples from PD patients compared to healthy controls. (f) Diagnostic efficacy of EAF2 in clinical samples (AUC = 0.842; t-test analysis, ****P < 0.0001).

