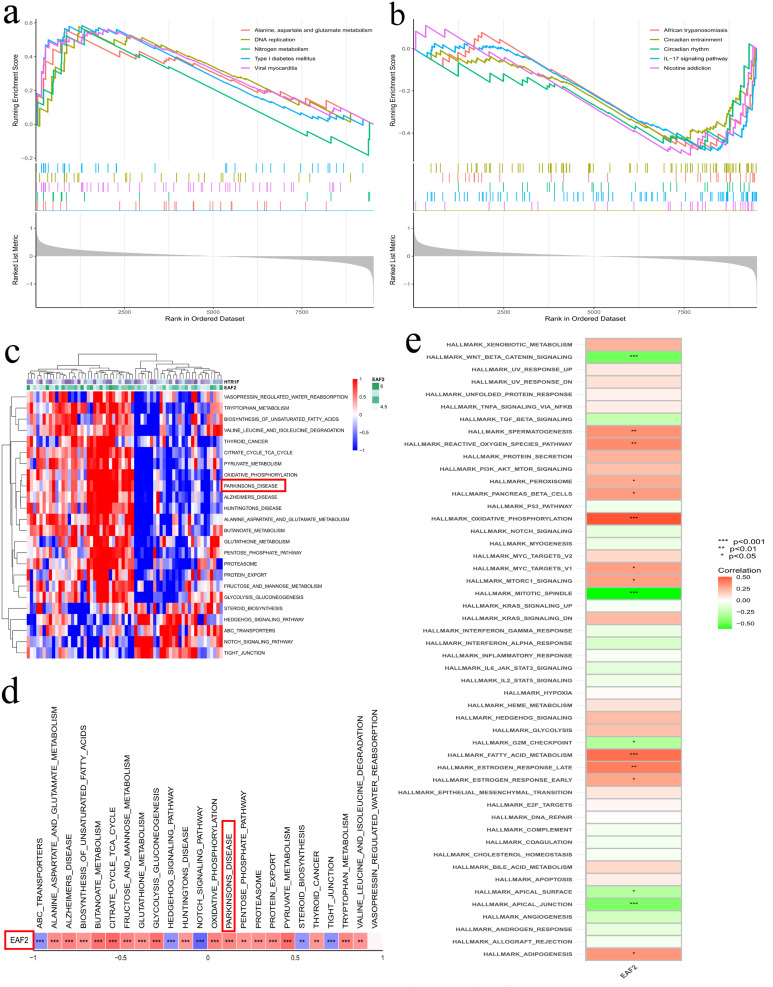
Figure 6.
Gene enrichment analysis. (a and b) Gene Set Enrichment Analysis (GSEA) results for top five positively and negatively correlated pathways with EAF2. (c and d) Single-gene GSEA revealing pathways enriched by EAF2 in PD. (e) Gene Set Variation Analysis (GSVA) indicating differential pathway expression of EAF2 in PD patients compared to normal controls.

