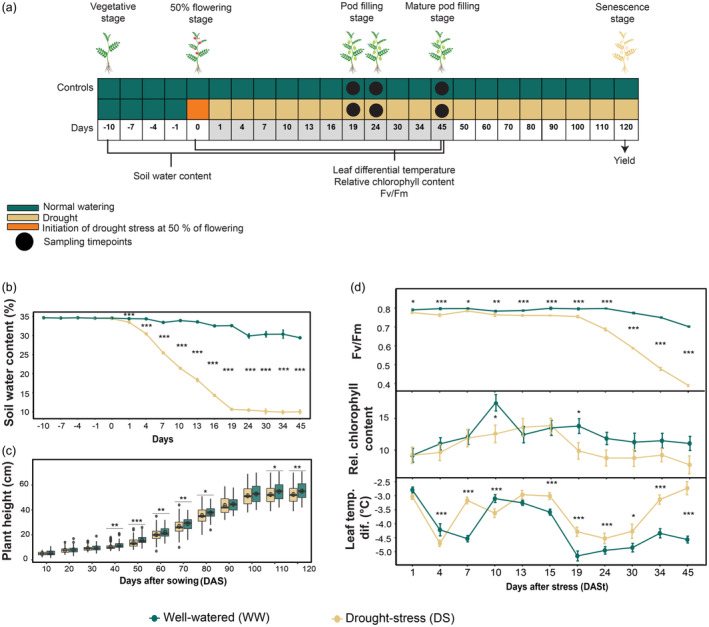
Figure 1.

(a) Experimental design. (b) Soil water content (SWC) (%). Values represent means, and error bars indicate the corresponding standard errors (n = 6). (c) Plant height (in cm). Boxplots representing the plant height measured. The boxplots show the median (central bar), the mean (central circle), the interquartile range (box), and minimum and maximum values (vertical bars). The circles outside the box show the outliers. The colour of the boxplots represents the different experimental conditions. (d) Maximum photochemical efficiency of PSII (F v /F m ), relative chlorophyll content and leaf temperature differential. Values represent mean, and error bars indicate the corresponding standard errors (n = 108). Means without at least one asterisk are non‐significant from each other (P > 0.05; one‐way ANOVA) between the treatments well‐watered (WW) and drought‐stressed (DS). Significance was tested for each time. Significance per day is indicated by asterisk (***P < 0.001; **P < 0.01; *P < 0.05).
