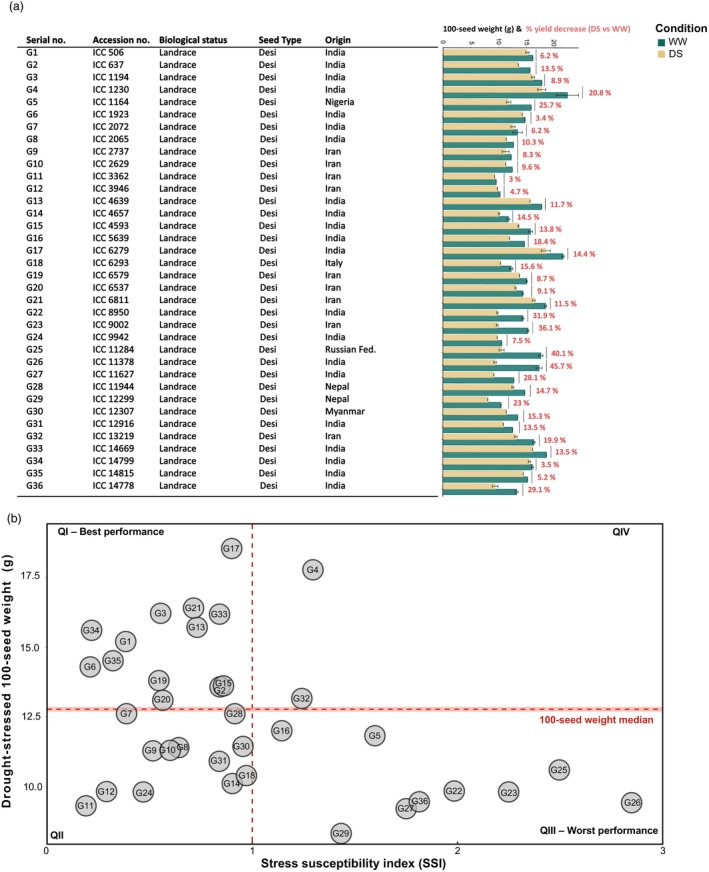
Figure 2.

(a) Natural variation in 100‐seed weight among chickpea genotypes with 100‐seed weight percentage decrease under drought stress. (b) Biplot with stress susceptibility index (SSI) and drought‐stressed 100‐seed weight of each chickpea genotype.
