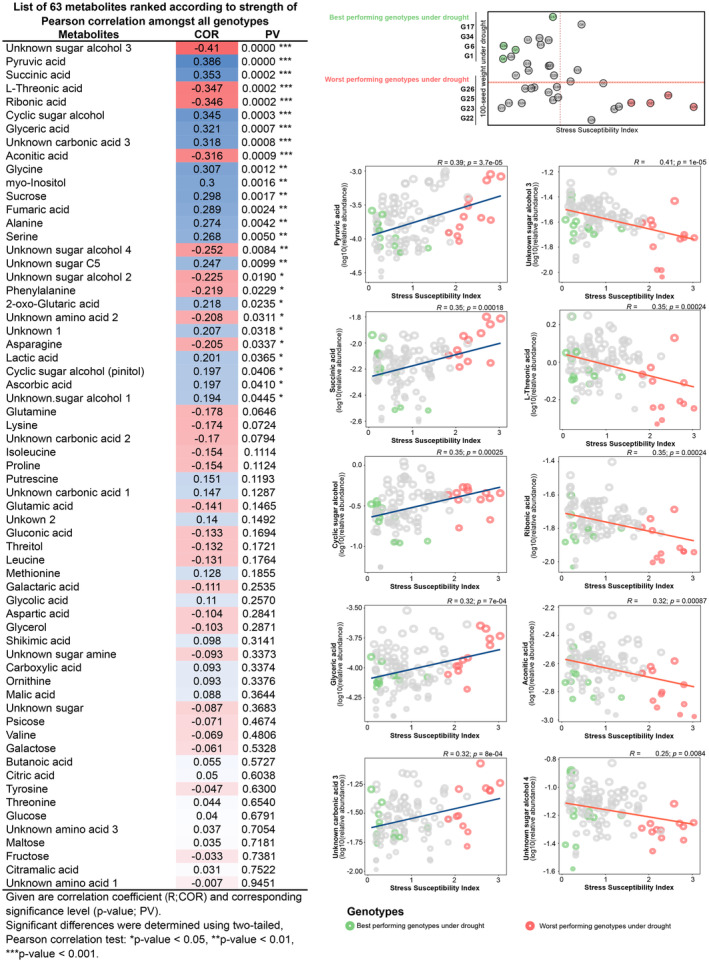
Figure 3.

Pearson correlation analysis to distribute the 36 diverse chickpea genotypes based on the performance concerning the metabolite and SSI (Stress Susceptibility Index) value. The pairwise correlations between all 63 measured metabolite levels and SSI were calculated. Positive correlations are shown in blue; negative correlations are shown in red. The intensity of blue or red represents the value of the correlation coefficient. The * indicates a statistically highly significant correlation (P‐value < 0.05) (Left panel). Metabolite‐SSI biplot shows the correlation strength between metabolites and SSI (Right panel). The size of each circle denotes the relative amount value of metabolites with the corresponding chickpea genotype. Genotypes with a lower SSI value and a higher 100‐seed weight value have been considered the best genotypes. Genotypes with a higher SSI value and a lower 100‐seed weight value have been considered the worst genotypes.
