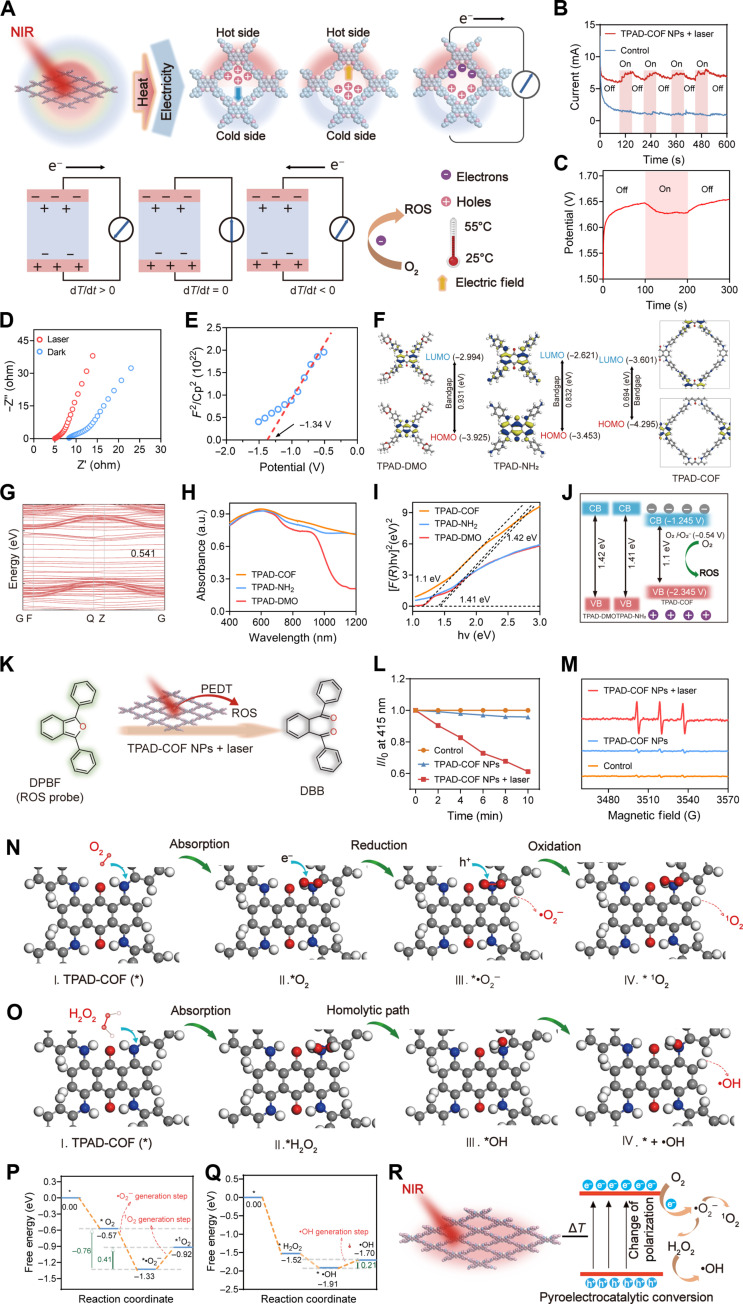
Fig. 3. PEDT effect and ROS generation of TPAD-COF NPs.
(A) Scheme of the pyroelectric effect of TPAD-COF NPs under temperature variations and relationship between temperature variations (dT/dt) and pyroelectric currents. (B) Pyroelectric currents of TPAD-COF NPs under 5 laser on/off cycles. (C) Pyroelectric potentials and (D) EIS Nyquist plots of TPAD-COF NPs before and after 808-nm laser irradiation. (E) Mott-Schottky curve of TPAD-COF NPs. (F) The optimized molecular structures and calculated HOMO-LUMO energy gaps of TPAD-DMO, TPAD-NH2, and TPAD-COF. (G) The electronic band structures of TPAD-COF. (H) UV-vis diffuse reflectance spectra of TPAD-DMO, TPAD-NH2, and TPAD-COF. (I) Bandgaps of TPAD-DMO, TPAD-NH2, and TPAD-COF. (J) Schematic illustration of the ROS generation mechanism. (K) Schematic representation of the 1O2 detection mechanism of DPBF. (L) Normalized changes in the absorbance of DPBF solution at 415 nm after different treatments. (M) ESR spectra of different treatment groups. (N and O) Schematic illustration of the formation process of (N) •O2− and 1O2, and (O) •OH. (P and Q) Reaction free energy plots of the (P) •O2− and 1O2 and (Q) •OH generation process. (R) Scheme of ROS generation by TPAD-COF NPs under NIR laser exposure.

