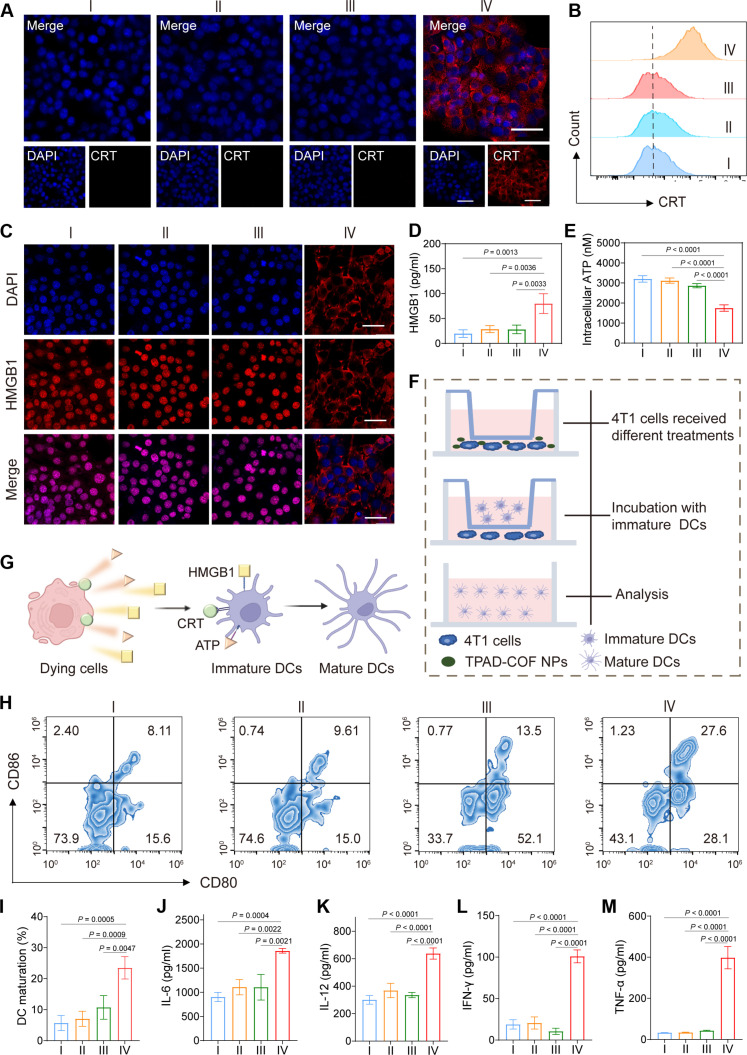
Fig. 5. TPAD-COF NP-mediated immune response upon NIR laser irradiation in vitro.
(A) Immunofluorescence images and (B) flow cytometry analysis of CRT in 4T1 cells after various treatments. (C) Immunofluorescence images and (D) ELISA analysis of HMGB1 in 4T1 cell supernatant after diverse treatments (n = 3). (E) Intracellular ATP content of 4T1 cells in different treatment groups (n = 3). (F) Scheme of the coincubation system of immature DCs and 4T1 cells. (G) The schedule mechanism of DC maturation triggered by DAMPs. (H) Flow cytometry analysis and (I) statistical analysis of DC maturation in different treatment groups (n = 3). (J to M) The secreted levels of cytokines (n = 3), including (J) IL-6, (K) IL-12, (L) IFN-γ, and (M) TNF-α, in different treatment groups. I: Control; II: Laser; III: TPAD-COF NPs (100 μg ml−1); IV: TPAD-COF NPs (100 μg ml−1) + laser (1.0 W cm−2, 10 min).

