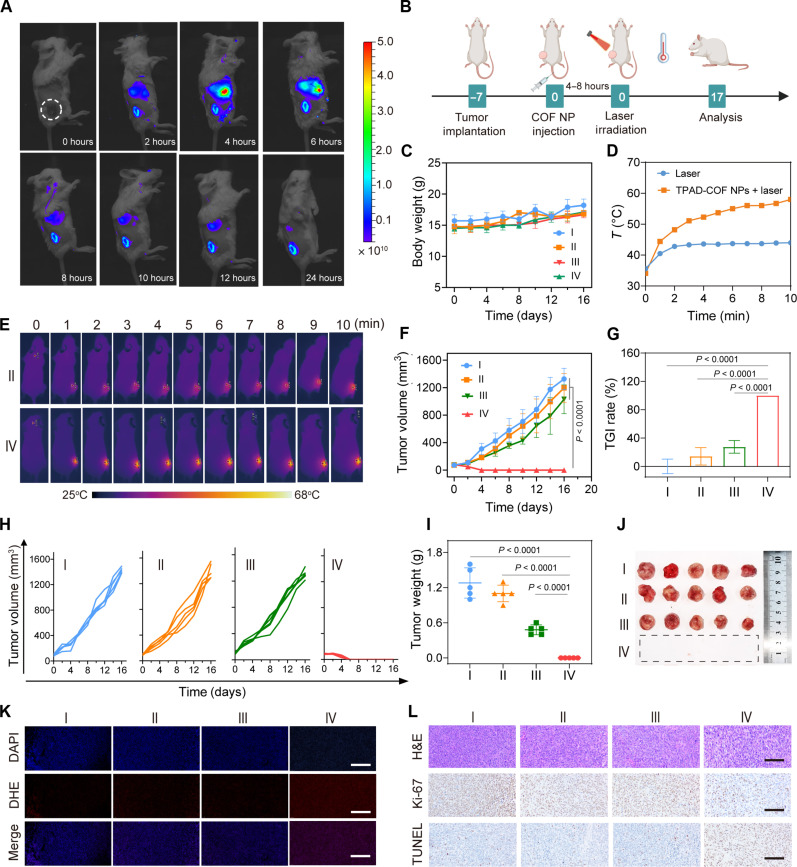
Fig. 6. In vivo antitumor effect of TPAD-COF NPs upon NIR exposure.
(A) Fluorescence images of mice after tail vein injection of Cy5.5-labeled TPAD-COF NPs for varying durations. (B) Scheme of the treatment process in vivo. (C) Body weights of mice in diverse groups (n = 5). (D) Tumor temperature curves of mice and (E) corresponding thermal images in the laser and TPAD-COF NPs + laser groups. (F) Tumor volumes, (G) TGI rates, and (H) individual tumor volumes (n = 5). (I) Tumor weights and (J) digital photograph of tumors after diverse treatments (n = 5). (K) Immunofluorescence images of ROS and (L) H&E, terminal deoxynucleotidyl transferase–mediated deoxyuridine triphosphate nick end labeling (TUNEL), and Ki-67 antibody staining images of tumor slices after diverse treatments. Scale bars, 100 μm. I: Control; II: Laser (1.0 W cm−2, 10 min); III: TPAD-COF NPs (100 μg ml−1); IV: TPAD-COF NPs (100 μg ml−1) + laser (1.0 W cm−2, 10 min).

