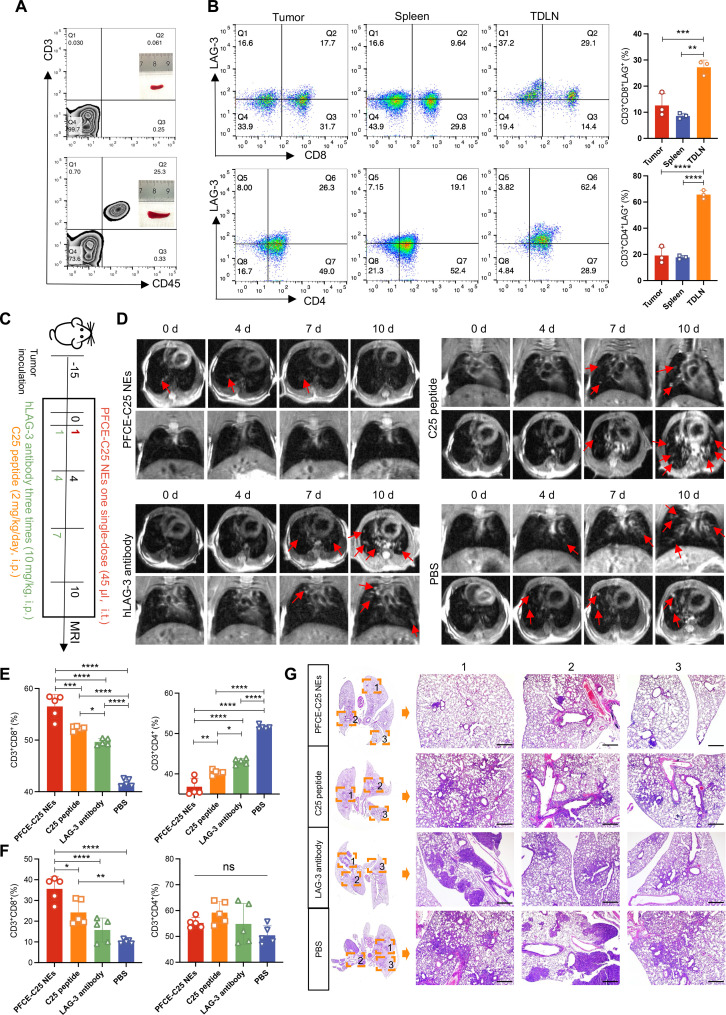
Fig. 10. The immune function of PFCE-C25 NEs in a HIS in situ lung cancer model.
(A) Flow cytometry results demonstrated the frequencies of hCD45+ hCD3+ cells in PBMCs from immunodeficient NOG mice that were repopulated with hPBMCs (n = 3). Additionally, the spleen size of reconstructed NOG mice was compared to that of nonreconstructed NOG mice. (B) Flow cytometry results showing hLAG-3 expression in NCI-H460 in situ lung tumors from a humanized mouse model. (C) Schematic diagram of the dosing and imaging regimen for each treatment group. (D) MRI results for immunotherapy monitoring. Red arrow points to the tumor. (E) CD8+ T cell and CD4+ T cell infiltration into the tumor. (F) CD8+ T cell and CD4+ T cell infiltration into the TDLNs; n = 5. The data are presented as the mean ± SD. (G) Representative H&E staining results of the lungs of HIS in situ lung cancer mouse model from each treatment group. Scale bar, 20 μm.

