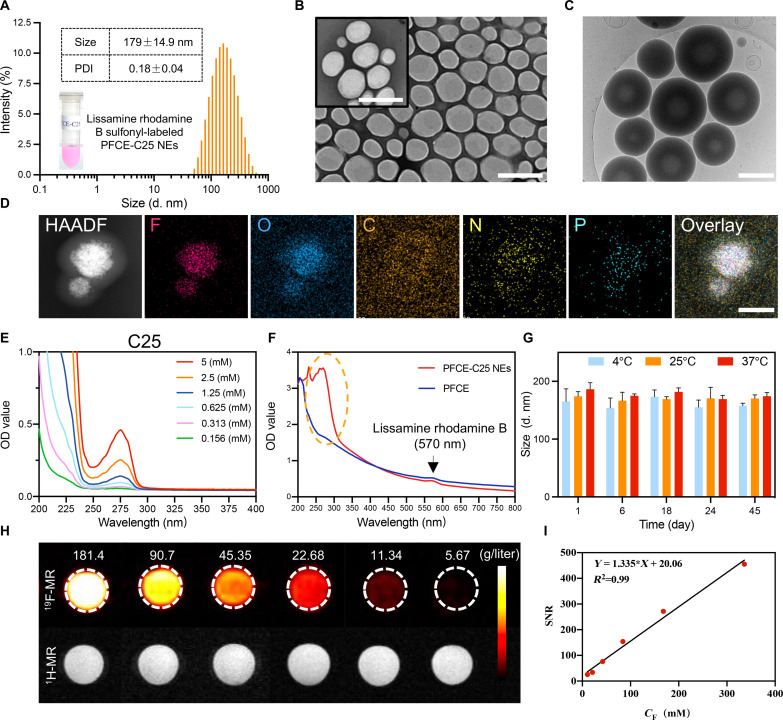
Fig. 2. Characterization of PFCE-C25 NEs.
(A) Intensity-weighted size distribution of PFCE-C25 NEs. (B) Morphology of PFCE-C25 NEs determined by TEM. Scale bars, 500 nm. (C) Cryo-TEM images of PFCE-C25 NEs. Scale bar, 200 nm. (D) Elemental mapping analysis of PFCE-C25 NEs. Scale bar, 100 nm. (E) UV-Vis absorption spectra of C25 cyclic peptides. (F) UV-Vis absorption spectra of the PFCE-C25 NEs and PFCE NEs. (G) Measurement of changes in the intensity-averaged hydrodynamic diameter size of PFCE-C25 NEs. Three-dimensional (3D) graphs were generated using Matlab based on the average values obtained. (H) 19F-MRI and 1H-MRI results of PFCE-C25 NEs. (I) Calculation of the SNR of PFCE-C25 NEs at different concentrations. The data are presented as the mean ± SD.

