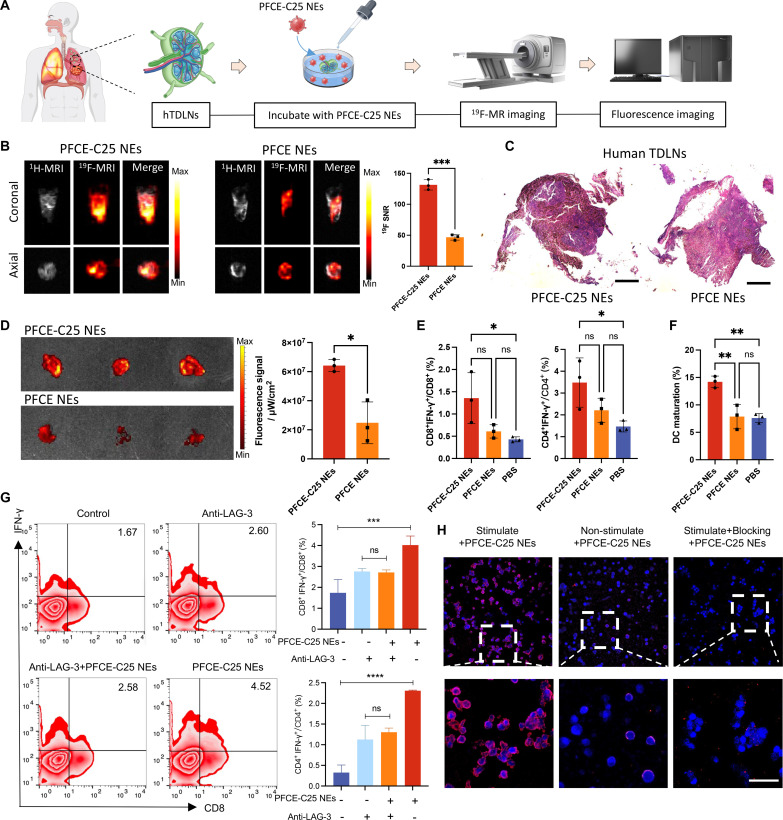
Fig. 3. The targeting and immune function of PFCE-C25 NEs in hTDLNs, hPBMCs, mCD8+ T cells, and lung tumor cells.
(A) Schematic illustration of hTDLN assay. (B) The 1H/19F MR images of hTDLNs were obtained after a 6-hour incubation with PFCE-C25 NEs or PFCE NEs (coronal and axial view). (C) Representative H&E staining results of the hTDLN in each group. Scale bar, 20 μm. (D) Representative IVIS imaging results of hTDLNs after incubation with PFCE-C25 NEs or PFCE NEs and the corresponding fluorescence signal analysis (n = 3). (E) Ability of PFCE-C25 NEs to stimulate the secretion of IFN-γ and increase the percentage of CD8+ IFN-γ+ T cells and CD4+ IFN-γ+ T cells in hTDLNs (n = 3). (F) Comparison of DC activation in hTDLNs from the PFCE-C25 NE–, PFCE NE–, and PBS-treated groups after 6 hours (n = 3). (G) Ability of PFCE-C25 NEs to stimulate the secretion of IFN-γ by hPBMCs and increase the percentage of CD8+ IFN-γ+ T cells and CD4+ IFN-γ+ T cells (n = 3). (H) Confocal fluorescence microscopy results of mCD8+ T cells after incubation with PFCE-C25 NEs or PFCE NEs for 4 hours. Magnification scale bar, 20 μm. The data are presented as the mean ± SD.

