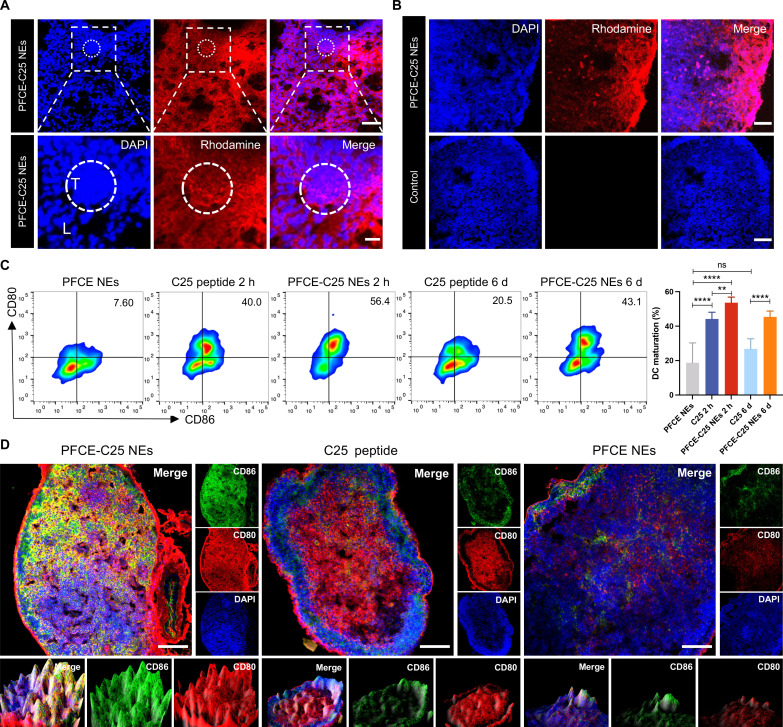
Fig. 4. Distribution of PFCE-C25 NEs in the lung and TDLNs and the activation of DCs.
(A) Confocal fluorescence microscopy results showing the distribution of PFCE-C25 NEs in lung (L) and LLC tumor (T) tissues. Scale bar, 100 μm (200 μm for magnification). (B) Distribution of PFCE-C25 NEs in LLC TDLNs after 6 hours of nebulization delivery of 50 μl of PFCE-C25 NEs. Scale bar, 100 μm. (C) Comparison of DC activation in LLC TDLNs from the PFCE NEs, PFCE-C25 NEs, and C25 administration groups after different durations (2 hours, 6 days, n = 6). (D) Confocal fluorescence microscopy results showing the degree of DC activation in the PFCE NE, PFCE-C25 NE, and C25 administration groups. Scale bar, 100 μm. The data are presented as the mean ± SD.

