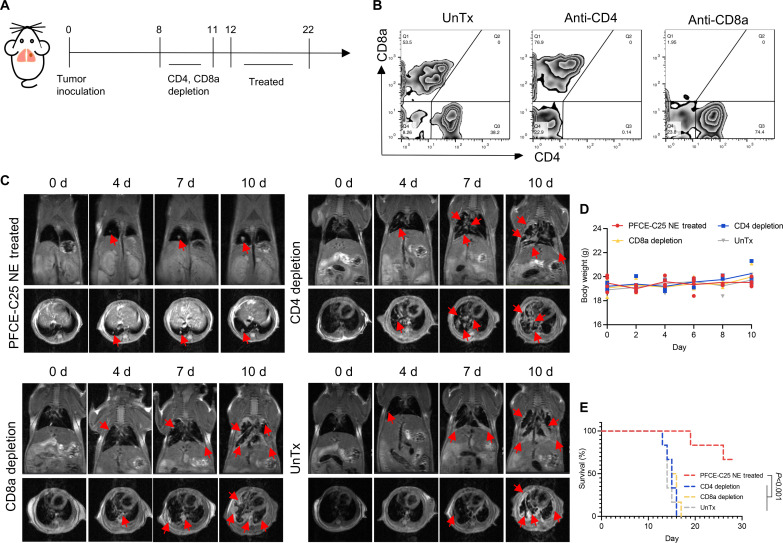
Fig. 7. Effect of PFCE-C25 NEs on an LLC metastatic model after the depletion of CD8+ T cells or CD4+ T cells in mice.
(A) Schematic diagram of the depletion and treatment regimen. (B) Flow cytometry results for CD8+ T cell– or CD4+ T cell–depleted mice. (C) MRI results for immunotherapy monitoring. The red arrow points to the tumor. (D) Mouse body weight measurements (n = 3). (E) Log-rank survival curve analysis.

