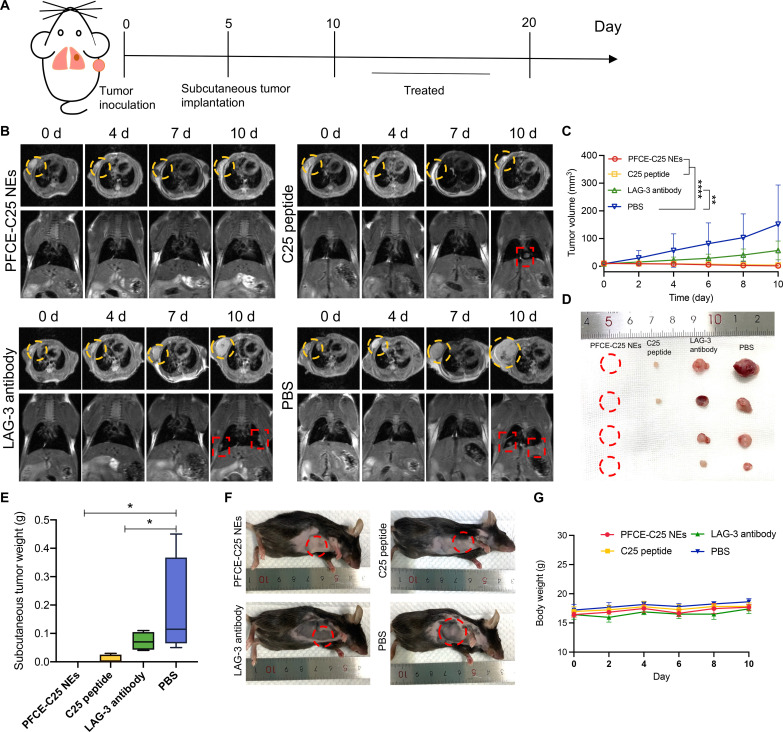
Fig. 8. PFCE-C25 NEs enhance local and distant tumor immune responses.
(A) Schematic diagram of tumor establishment and the treatment regimen. (B) MRI results for immunotherapy monitoring. (C) Subcutaneous tumor volume of each treatment group. (D) Subcutaneous tumor images of each treatment group. (E) Subcutaneous tumor weight of each treatment group. (F) Representative mouse images from each treatment group. (G) Mouse body weight changes. The data are presented as the mean ± SD; n = 5 mice in PFCE-C25 NE and C25 peptide groups; n = 4 mice in LAG-3 antibody and PBS groups.

