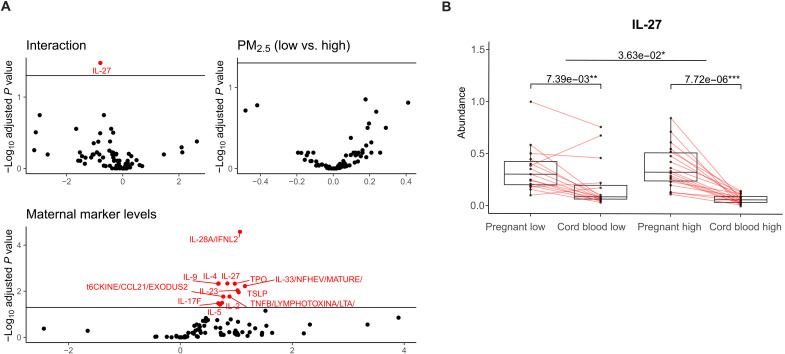
Fig. 3. Impact of prenatal PM2.5 exposure during third trimester on neonatal-maternal cytokine association, especially IL-27.
(A) Volcano plots summarize the β coefficients and statistical significance for the association between maternal marker levels and CB markers (see Materials and Methods). Multiple testing corrections were performed by using FDR at 0.05. A positive β coefficient can be interpreted that 1-U increase in maternal cytokine will increase the cytokines level in CB by β estimates. A β coefficient of PM2.5 (binary indicator; low versus high) can be interpreted that cytokine levels in CB will change by β among high maternal PM2.5 exposure compared to the low exposure group. A β coefficient of interaction between maternal cytokine levels and PM2.5 status can be interpreted as the relation between maternal cytokine and corresponding cytokine in CB getting weaker in CB from high maternal PM2.5 exposure compared to those with low maternal PM2.5 exposure. (B) Box plots for levels of IL-27 in pregnant women and CB. The exposure group is defined on the basis of the mother’s exposure status during the 3 months before the blood collection, categorized as low or high. Points are samples in each group and matched pregnant women and CB are connected by a line. Q values of the differences within exposure status and between pregnant and nonpregnant women are noted with significant levels. Q values below 0.05 get one star (*); below 0.01, two stars (**); and below 0.001, three stars (***).

