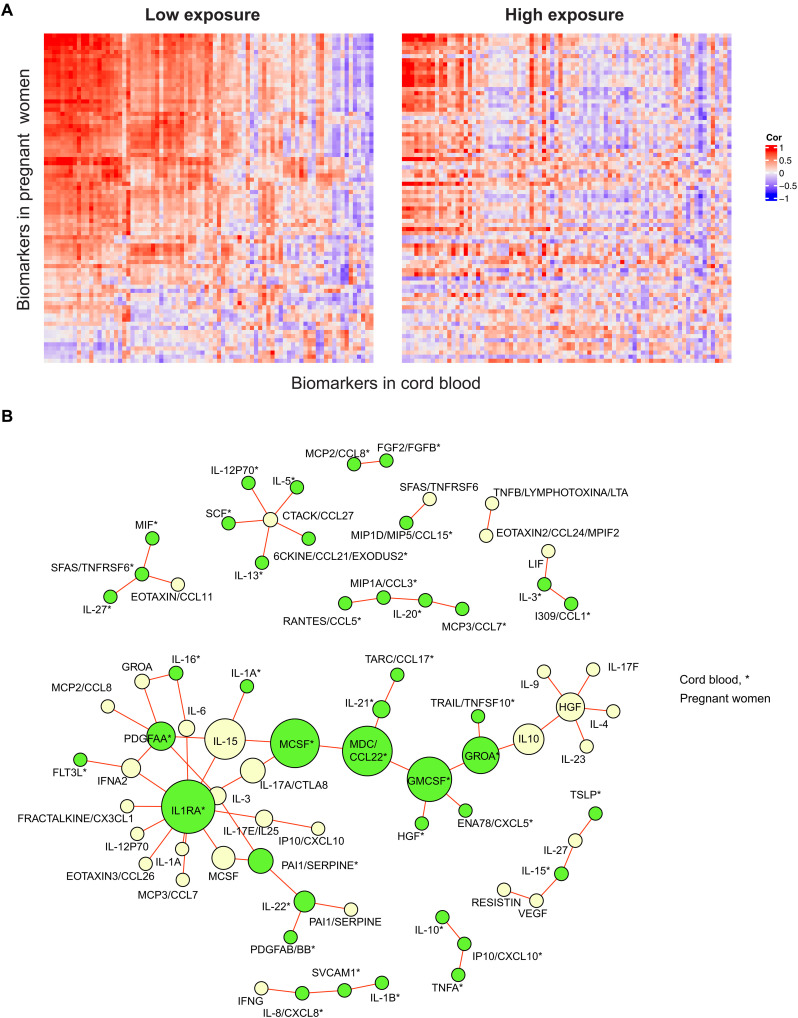
Fig. 4. Different coexpression patterns in maternal-neonatal pairs between low versus high exposure.
(A) The Pearson correlation matrixes for PM2.5 exposure level (low versus high during the third trimester) show correlations between maternal and neonatal cytokines. Red and blue indicate direct and reverse correlations, respectively. (B) A coexpression differential network was created to compare cytokines that have different coexpression patterns by PM2.5 exposure levels (low versus high) during the third trimester. The edges in the network indicate that the markers are strongly coexpressed, but the direction of coexpression is opposite in low and high exposure. An asterisk (*) next to the marker name indicates that the marker is from CB. The nodes, which represent the cytokines, were colored according to sample type, with pregnant women in beige and CB in green. The size of the nodes is based on the BC, which measures the centrality based on shortest paths.

