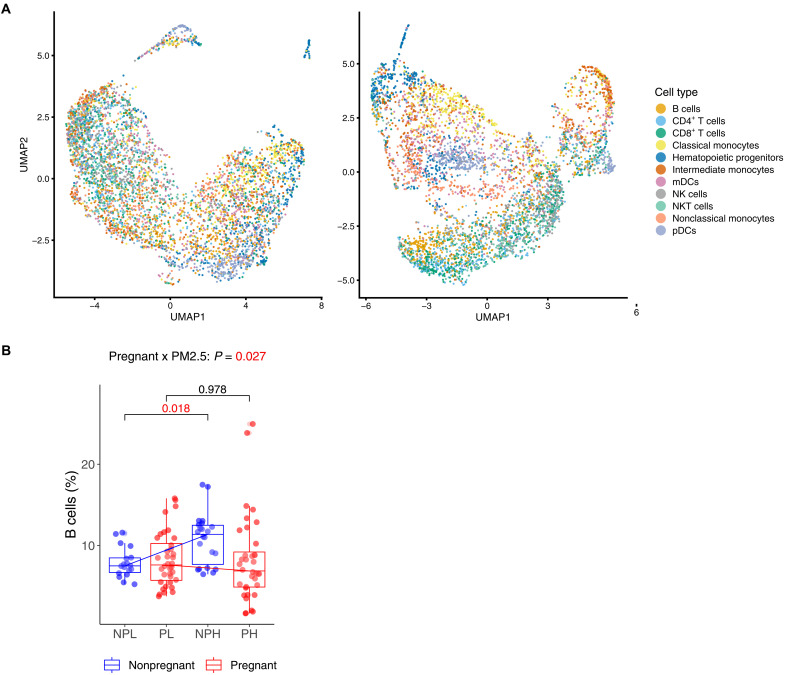
Fig. 5. Impact of PM2.5 on immune cell type proportion depending on pregnancy status.
(A) Single-cell UMAP visualizations of histone acetylation and methylation, colored by cell type identity. (B) Frequency of immune cell subtypes in low and high PM2.5 exposure groups of pregnant and nonpregnant women. The y axis represents the frequency of cells as a percentage of a total number of 11 immune cells population, and the x axis shows the groups categorized by pregnant and PM2.5 exposure states: NPL (nonpregnant low), NPH (nonpregnant high), PL (pregnant low), and PH (pregnant high). The box plot is colored by pregnant status (red, pregnant; blue, nonpregnant). Lines present the changes in cell proportions between low and high exposures within each pregnant status. P values (P) of the interaction term between pregnant status and PM2.5 exposure are noted above graph.

