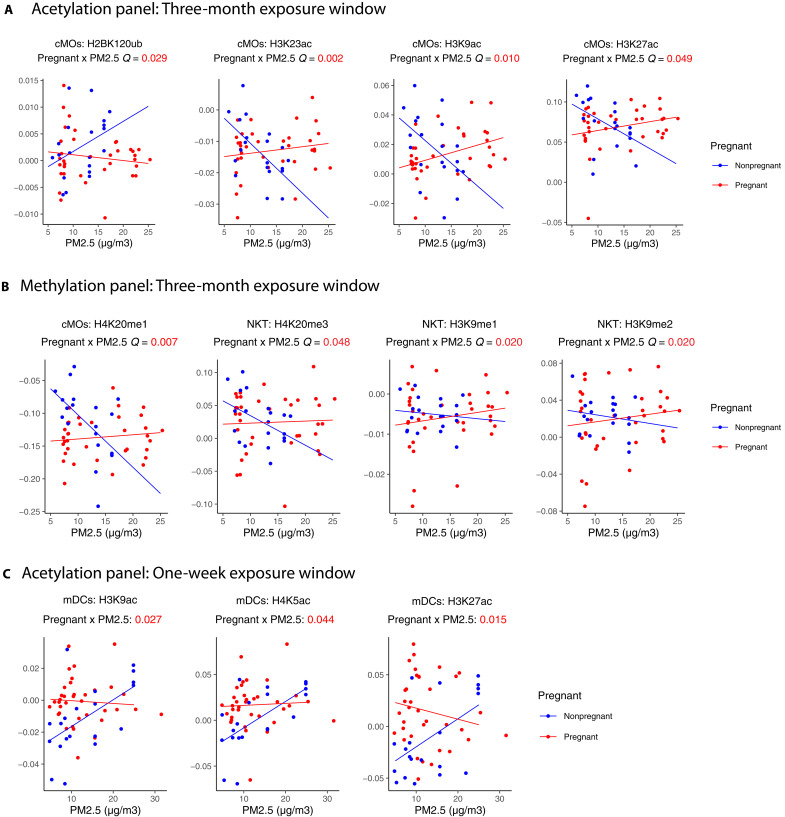
Fig. 6. An association between PM2.5 exposure and H2AK119Ub, H3K9ac, H3K23ac, H3K27ac, H4K5ac, H3K9me1/2 and H4k20me1/3 in pregnant women versus nonpregnant women across different exposure windows and cell types.
Scatter plots of (A) 3-month window PM2.5 concentration versus the levels for H2BK120ub, H3K23ac, H3K9ac, and H3K27ac in cMOs; (B) 3-month window PM2.5 concentration versus the levels for H4K20me1, H4K20me3, H3K9me1 and H3K9me2 in cMOs; and (C) 1-week window PM2.5 concentration versus the levels for H3K23ac, H3K9ac, H4K5ac, and H3K27ac in mDCs, which had a significant interaction effect. Points and lines on the scatter plot are colored by pregnant status (pregnant women in red and nonpregnant women in blue). Lines shown are fitted within the pregnant status. FDR-adjusted P values (Q value) of the statistical interaction term between pregnant status and PM2.5 levels are noted below the cytokine name. Descriptions for the abbreviations of histone modifications can be found in table S1.

